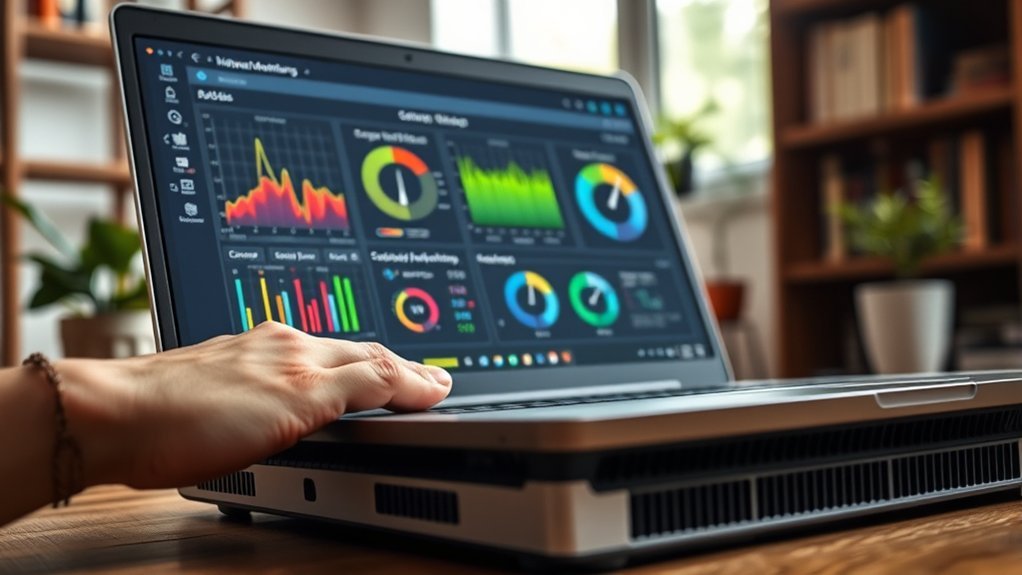
Laptop CPU and GPU temperatures are best checked with monitoring tools such as HWiNFO, Core Temp, or HWMonitor, which show real-time sensor data for CPU cores and the graphics processor. A static check is also possible in BIOS or UEFI under Hardware Monitor or System Health. Typical load temperatures are about 40–70°C for CPUs and 70–85°C for GPUs. Persistent temperatures above 90°C suggest overheating and possible throttling. Additional methods and corrective steps follow.
Check Laptop CPU and GPU Temp on Windows
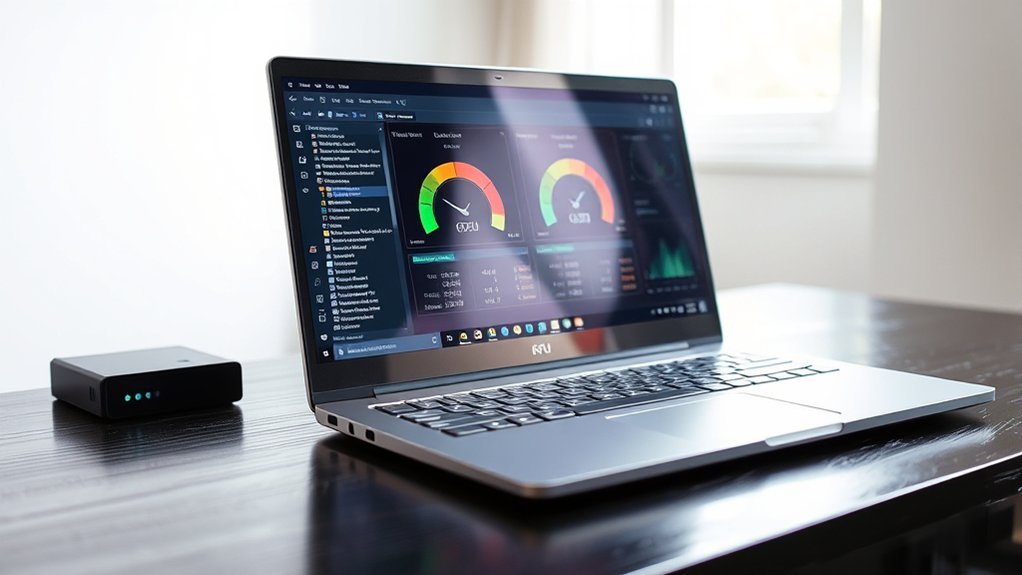
Most Windows laptops require third-party utilities to read CPU and GPU temperatures accurately in real time, since the operating system does not provide a built-in per-component thermal display.
To check CPU temperature and track GPU temperatures, users typically rely on third-party monitoring tools such as HWiNFO or MSI Afterburner. These applications deliver real-time temperature data during gaming, rendering, or other sustained workloads, enabling informed control rather than guesswork.
Use HWiNFO or MSI Afterburner for real-time CPU and GPU temperature monitoring under sustained workloads.
For static verification, BIOS or UEFI firmware can expose CPU monitoring values during startup, though these readings are limited and do not reflect live workload behavior. A normal operating temperature for laptop CPUs commonly falls between 40°C and 70°C under load, while discrete GPUs often operate between 70°C and 85°C.
If readings climb beyond expected thresholds, maintenance becomes necessary. Users seeking thermal stability should clean laptop vents and fans regularly, because dust accumulation restricts airflow, distorts sensor interpretation, and increases overheating risk during prolonged use and system stress.
Use Core Temp to Check CPU Temp
Core Temp can be installed from its official website, with bundled offers unchecked to maintain a clean setup.
After launch, it reports real-time temperatures for each CPU core and lists current, minimum, and maximum readings to assess thermal variation.
Taskbar monitoring and temperature alerts can then be enabled from the Options menu for continuous visibility.
Install Core Temp
Download the latest release from the official Core Temp website and complete the installation, clearing any bundled software checkboxes before proceeding. This Download and Install step keeps the system uncluttered and under user control. After setup, Launch Core Temp and verify that the application initializes correctly for immediate CPU temperature oversight and early Thermal throttling diagnosis.
| Action | Purpose |
|---|---|
| Launch Core Temp | Start monitoring |
| Customize Settings | Enable taskbar access |
| Monitor Real-Time Data | Track load changes |
| Mini-Mode | Reduce screen use |
From Options, Customize Settings by enabling the notification area icon. This provides fast access without dependence on full-window visibility. Mini-Mode further supports unobtrusive oversight, while Core Temp continues to Monitor Real-Time Data in the background during ordinary laptop workloads.
Read Core Temperatures
With Core Temp running, the next step is to read the per-core temperature values shown in the main window. Core Temp reports real-time temperature readings from Digital Thermal Sensors, giving a direct view of CPU temperatures without vendor lock-in.
Each core appears separately, allowing precise comparison under idle or load conditions. This layout helps monitor temperature behavior across supported processors, including Intel CPUs and an AMD CPU.
Attention should be given to current values and to the highest and lowest temperatures logged during testing, since these reveal spikes, cooling recovery, and possible overheating patterns. Core Temp works across multiple Windows versions and may also present data through its gadget interface.
Although customizable notification options exist, the immediate task here is interpretation: identify abnormal cores, confirm thermal consistency, and reclaim informed control over system limits.
Enable Taskbar Monitoring
Core Temp also supports the Core Temp Gadget for desktop visibility of load and current temperature in real time.
Color-coded readings clarify thermal thresholds and expose overheating risks before throttling begins.
For stronger performance tracking, the utility reports each core’s current temperature, plus recorded minimum and maximum values under changing workloads.
This detached telemetry gives users immediate, independent insight into processor behavior and thermal stress, without vendor-imposed opacity or guesswork.
Use HWMonitor to Check CPU and GPU
Open HWMonitor to obtain real-time CPU and GPU temperature data from each component’s digital thermal sensors. This lightweight utility helps users monitor processor behavior without vendor lock-in, exposing current, minimum, and maximum temperature readings for rapid diagnosis.
HWMonitor reports CPU temperature and GPU temperature with sufficient precision to detect overheating issues during resource-heavy tasks such as gaming, rendering, or compilation. Its broad hardware support covers Intel and AMD CPUs alongside NVIDIA and AMD graphics cards. Color-coded indicators further simplify interpretation, allowing independent assessment of safe or abnormal operating ranges.
- Uses digital thermal sensors to deliver accurate temperature readings across supported laptop hardware.
- Shows current, minimum, and maximum values, helping identify spikes, throttling patterns, and abnormal fluctuations.
- Helps monitor processor and graphics workloads under resource-heavy tasks without intrusive system overhead.
- Supports liberation through transparent hardware visibility, enabling faster response to overheating issues before instability worsens.
This diagnostic method remains practical for routine checks and stress observation.
Check Laptop Temp in BIOS or UEFI
Although software tools provide continuous telemetry, BIOS or UEFI offers a hardware-level temperature check that can help verify CPU and, on some systems, GPU readings independently of the operating system.
To check your CPU temperature this way, the user restarts the laptop and enters BIOS/UEFI during startup, usually by pressing Delete, F2, or Esc before the OS loads. This method supports a more self-directed diagnostic path.
Restart the laptop and enter BIOS/UEFI at startup for a direct, self-guided CPU temperature check.
Inside BIOS/UEFI, the relevant menu is typically labeled Hardware Monitor or System Health. There, real-time temperature readings may appear for the laptop’s CPU and sometimes the CPU and GPU together, depending on firmware support.
Because this environment usually shows a static snapshot rather than long-term tracking, it is best used for initial diagnostics and quick confirmation. Some laptops expose only the laptop’s CPU value and omit GPU data entirely.
After the temperature check, the user exits without saving changes and returns to the operating system safely.
Learn What Laptop Temps Are Normal
Normal laptop CPU temperatures typically remain around 40°C to 70°C during routine operation, while GPU temperatures often stay within 30°C to 80°C, with higher values expected under load.
Under gaming, rendering, or similar sustained workloads, brief peaks near 85°C may be acceptable, but consistent operation above 90°C indicates elevated thermal risk.
Common heat warning signs include thermal throttling, excessive fan noise, hot chassis surfaces, and sudden performance drops, often aggravated by restricted airflow or dust buildup.
Safe Idle Ranges
Baseline idle temperatures provide the quickest reference for judging laptop thermals. Typical CPU temps at rest fall between 35°C and 60°C, while GPU readings usually sit between 30°C and 50°C. These normal idle temperatures define a practical operating temperature window and help users monitor CPU behavior without guesswork.
- CPU idle above 60°C suggests the cooling system may be restricted or degraded.
- GPU idle above 50°C can signal poor airflow, dust buildup, or failing fan response.
- High-quality thermal paste supports lower baseline readings and delays critical heat accumulation.
- Ambient room temperature directly shifts idle values, so warmer spaces raise readings slightly.
Regular checks liberate maintenance decisions from assumptions. Stable idle baselines protect longevity, preserve performance, and reveal thermal drift before damage develops.
Consistent monitoring builds confidence and control.
Load Temperature Limits
Under sustained load, laptop thermal behavior shifts into a higher but still controlled range. Relative to normal idle temperatures, CPU temperature commonly rises into 70°C to 80°C during gaming and intensive tasks, while many CPUs remain within safe load temperature limits up to 85°C.
GPUs often operate efficiently between 80°C and 90°C under comparable demand.
These figures help users consistently monitor systems with third-party software and act with independence rather than guesswork. The diagnostic boundary is defined by critical overheating thresholds: around 95°C for CPUs and 100°C for GPUs, where protection mechanisms may trigger performance throttling or shutdown.
Sustained operation beyond recommended limits is not freedom; it accelerates wear, reduces long-term reliability, and constrains hardware longevity. Proper monitoring turns thermal data into practical control.
Laptop Heat Warning Signs
Temperature ranges become more useful when paired with observable warning signs. Normal CPU temperatures often sit between 35°C and 60°C at idle, then rise to 80°C to 95°C during resource-intensive tasks. When a laptop repeatedly exceeds 90°C, overheating becomes likely, increasing risk of performance throttling and hardware stress.
Diagnostic clues include increased fan noise, reduced responsiveness, and unexpected shutdowns under load.
- Idle heat above expected baselines may signal dust buildup or failing cooling components.
- Sustained spikes during gaming or editing suggest inadequate thermal headroom.
- Users should monitor laptop temperatures and target below 85°C for stable operation.
- Cleaning vents, servicing fans, and maintaining proper airflow help prevent critical escalation.
These signs allow earlier intervention and greater control over system stability, lifespan, and independent performance freedom.
Spot Signs Your Laptop Is Overheating
When a laptop begins to overheat, the earliest signs are usually mechanical and performance-related rather than numerical. Excessive fan noise commonly appears first, signaling the cooling system is compensating for rising internal temperatures.
Heat concentrated around vents or the chassis also indicates overheating, especially during ordinary workloads. These outward symptoms help users identify strain before measuring exact CPU temperature or GPU readings directly.
A noticeable performance drop, including lag, stutter, or slowed application response, often points to thermal throttling triggered by elevated processor heat.
In more severe cases, sudden restarts or shutdowns occur when components approach critical temperature thresholds, commonly near 212°F or 100°C. Repeated warning messages from system diagnostics or firmware utilities further confirm thermal distress and suggest immediate inspection is necessary.
Recognizing these signs early gives the user freedom from guesswork, allowing informed action before heat-related instability, hardware degradation, or data loss escalates into a larger system failure.
Lower Laptop CPU and GPU Temps Safely
Reduce heat at the source by improving airflow, minimizing thermal resistance, and verifying operating temperatures under load. Safe temperature control depends on disciplined maintenance, correct placement, and precise measurement. Users should monitor temperatures with Core Temp or MSI Afterburner and keep CPU temperatures and GPU temperatures below 85°C during sustained workloads to prevent thermal throttling.
- Clean vents and fans regularly; dust restriction can raise heat sharply, while proper airflow may cut temperatures by up to 20°C.
- Place the laptop on a hard, flat surface so intake and exhaust paths remain unobstructed and cooling efficiency stays stable.
- Add a cooling pad during gaming, rendering, or video editing to increase airflow and reduce localized chassis heat.
- Replace degraded thermal paste every two to three years; weakened conductivity can increase temperatures by 10°C or more.
These measures free performance from avoidable thermal constraints and extend component reliability without risky overclocking or unnecessary hardware modification over time.
Frequently Asked Questions
How to Check CPU and GPU Temperature on Laptop?
CPU and GPU temperatures on a laptop are checked using Software tools like HWMonitor, Core Temp, or MSI Afterburner for Performance monitoring, Fan speeds, Overheating signs, Thermal throttling, Laptop cooling, System stability, and Hardware upgrades.
How Do I Know the Temperature of My CPU and GPU?
They determine CPU and GPU temperature through performance monitoring utilities or BIOS sensors, verifying sensor accuracy against temperature thresholds. Laptop cooling, thermal paste, hardware maintenance, overclocking effects, and energy efficiency collectively govern sustained thermal behavior.
Is 70 Degrees Hot for CPU and GPU?
70°C is generally acceptable; a stitch in time saves nine. Within ideal temperature ranges, thermal throttling effects remain unlikely, though temperature monitoring software should assess impact on performance, signs of overheating, fan noise levels, hardware lifespan implications.
Is 84 C Hot for a GPU?
Yes, 84°C is hot for a GPU; it nears thermal throttling under load. Diagnostic focus should assess GPU cooling, fan speed, laptop ventilation, heat management, gaming performance, overclocking risks, and hardware longevity for sustained autonomy.
Conclusion
Checking CPU and GPU temperature is like reading the gauges in an engine room before damage spreads below deck. Utilities such as Core Temp, HWMonitor, and BIOS tools provide the needed measurements, while normal ranges and overheating symptoms supply diagnostic context. When values climb too high, corrective steps restore thermal balance and system stability. In practice, routine temperature monitoring helps a laptop avoid throttling, component stress, unexpected shutdowns, and shortened service life over time.
