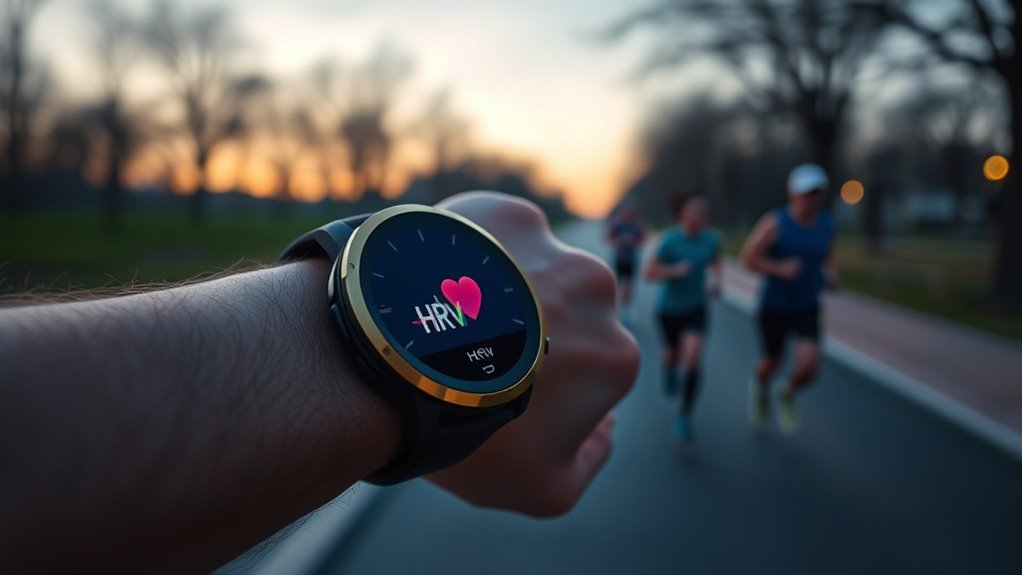
Garmin HRV Status compares your overnight heart rate variability to a personal baseline built from about three weeks of consistent sleep tracking. The range reflects recovery, stress, and autonomic balance — not a universal standard shared by everyone. Balanced means your readings sit near your own baseline, Unbalanced signals rising strain, Low suggests a clearer drop in recovery, and Poor points to a longer-term average sitting below typical health norms for your age. Sleep, training load, stress, hydration, and recovery habits all move the status in measurable ways — here’s exactly how it works and what to do about it.
Quick Answer
Garmin HRV Status compares your rolling 7-day heart rate variability average against your own 3-week personal baseline. Balanced means you’re recovering well; Unbalanced or Low signal rising fatigue or stress; Poor compares your baseline to age-based health norms rather than your personal history.
Key Takeaways
Key Takeaways
- Garmin HRV Status uses overnight heart rate variability, measured with the wrist’s optical sensor, to estimate recovery and autonomic balance.
- It builds a personal baseline after about three weeks of consistent overnight wear, so your own range matters more than population averages.
- Balanced means your 7-day HRV average sits within your personal range; No Status simply means there isn’t enough data yet.
- Unbalanced and Low compare you to your own baseline; Poor is different — it compares your baseline to general age-based norms.
- HRV Status is a wellness feature, not a medical diagnostic tool — treat it as one input alongside how you actually feel.
What Is Garmin HRV Status?
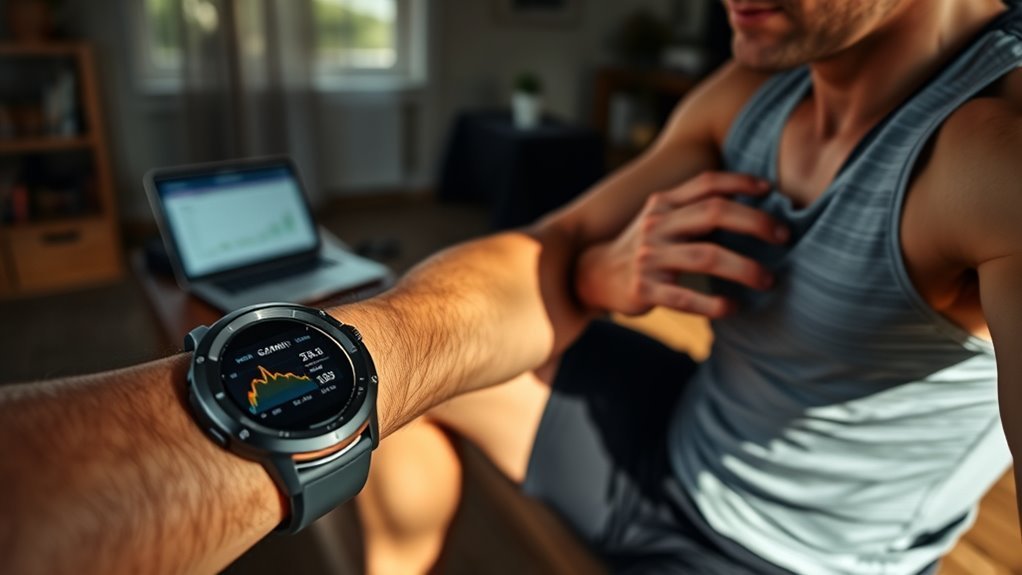
Garmin HRV Status is a sleep-based metric that tracks heart rate variability overnight and uses the average, measured in milliseconds, to estimate how well your body is balancing parasympathetic and sympathetic nervous system activity.
Garmin builds a personal baseline after about three weeks of consistent overnight readings. Once that baseline exists, it’s used to judge whether your current HRV is stable, elevated, or suppressed relative to *you* — not to everyone else wearing the same watch.
Status labels — Balanced, Unbalanced, Low, and Poor — translate the numbers into a simple recovery signal. A Balanced reading suggests your system is adapting well; lower readings can point to stress, fatigue, or reduced readiness.
Note: HRV Status is built on Firstbeat Analytics physiology algorithms, which Garmin acquired in 2020 after using the technology across its product line for over a decade. It’s a wellness and training feature, not a medical diagnostic — it doesn’t replace a conversation with a doctor about your heart health.
How Does Garmin Measure HRV During Sleep?
Garmin records HRV during sleep only, using an optical sensor that reads pulse flow through photoplethysmography (PPG).
It tracks beat-to-beat intervals continuously overnight and charts the data across five-minute windows for analysis, then produces a single average for the whole sleep period when you wake up.
A baseline is built from consistent use over time, letting your sleep HRV be compared against your own norms rather than a generic scale.
Sleep-Only HRV Recording
HRV is recorded only during sleep to improve consistency and cut down on the noise of daytime activity, since the body is in a more stable resting state at night. Garmin measures heartbeat intervals in milliseconds across the whole sleep period, then averages them in five-minute blocks to track how variability shifts through the night.
This sleep-only approach keeps the baseline cleaner, because movement and daytime stress artifacts are largely removed from the picture. For the most reliable results, wear the watch to sleep as consistently as you can — Garmin’s guidance is simply that regular nightly wear gives the algorithm enough input to build an accurate personal profile, rather than a specific nights-per-week minimum.
After about three weeks of consistent collection, trends become clearer and the average starts to reflect your individual range more accurately. The result is a data set built on repeatable nighttime conditions, which is what makes night-to-night comparisons meaningful in the first place.
Optical Pulse Sensing
Optical photoplethysmography (PPG) is the method Garmin uses to measure HRV during sleep, with the Elevate optical heart rate sensor shining light into the skin and detecting reflected changes in blood flow.
By tracking heartbeats continuously, the watch measures HRV from millisecond intervals between beats, feeding a status readout that’s grounded in actual physiology rather than a single instantaneous reading. The system averages data in five-minute windows, which reduces noise and improves night-to-night consistency.
These small variations in pulse timing reflect autonomic nervous system activity, offering a practical signal of recovery, strain, and sleep quality. Once enough nights are collected, the result can be compared against your own baseline HRV and normal range.
That comparison is what lets you tell whether your body is trending toward balance or drift, instead of guessing from a single night’s number.
Nightly Baseline Calculation
Consistency is the foundation of Garmin’s nightly HRV baseline calculation. During sleep, the Elevate sensor uses optical photoplethysmography to track pulse wave blood flow and compute HRV in milliseconds from beat-to-beat variation.
The baseline becomes meaningful only after roughly three weeks of consistent overnight wear — enough to define a personal range. After about one week, Garmin also produces a 7-day average HRV, which situates each night’s reading against what’s normal for you specifically.
This comparison shapes HRV status with far less guesswork than a single nightly number could offer on its own. Continuous sleep tracking links the average HRV trend to recovery and readiness, showing how your body responds to stress and rest over time.
Why Does Your HRV Baseline Matter?
An HRV baseline matters because it gives you an individual reference range for interpreting heart rate variability, which makes stress and recovery trends far more meaningful than comparing yourself to a generic number.
With about three weeks of consistent tracking, Garmin builds a personal average HRV that reflects your own normal variation. This is more useful than population norms because age, fitness level, genetics, and health history all shift what’s typical for a given person.
HRV status becomes clearer when current readings are compared with your own baseline, rather than with someone else’s numbers. A balanced HRV status suggests recovery is keeping pace with demand, while values outside your range can signal strain, insufficient recovery, or overtraining.
That context supports practical lifestyle adjustments — training load, sleep timing, hydration — grounded in your own data instead of a one-size-fits-all target.
Over time, shifts in the baseline itself can also show whether your training is building resilience or quietly creating fatigue. That’s the real value of tracking it: not a single “good” number, but a trend you can act on.
What Do the HRV Status Labels Mean?
Garmin classifies HRV status by comparing your 7-day rolling average against your personal baseline — and, for one label specifically, against age-based reference ranges.
Balanced indicates the average is within your baseline, while Unbalanced, Low, and Poor reflect increasing levels of deviation from expected recovery or health norms. A fifth state, No Status, simply means there isn’t yet enough overnight data to calculate a reliable 7-day average.
Balanced, Unbalanced, Low, Poor — and No Status
The HRV status labels translate a 7-day heart rate variability trend into a simple recovery signal.
Balanced means your average HRV stays inside your personal baseline, implying stable adaptation and effective recovery.
Unbalanced means your average HRV has moved outside that range — above or below — often reflecting accumulated fatigue or a training load that needs adjusting.
Low indicates a clearer drop well below your baseline, usually tied to stress, heavier training load, or insufficient recovery.
Poor works differently: it means your average is sitting below general health norms for your age group, which is worth a closer look rather than a single day’s decision.
No Status isn’t a health signal at all — it just means Garmin hasn’t collected enough consistent overnight data yet to produce a 7-day average. Wearing the watch to sleep more consistently is the only fix.
- Balanced: keep current load.
- Unbalanced: reduce pressure.
- Low or Poor: prioritize recovery.
How Garmin Classifies Status
What actually separates these labels is *what they’re compared against*, not just how far the number has moved. Balanced, Unbalanced, and Low are all judged against your own personal baseline — the range Garmin built from your last several weeks of sleep. Poor is judged against something different: general, age-based health norms, independent of your personal history.
That distinction matters practically. An Unbalanced or Low reading usually reflects something recent and reversible — a rough week, a hard training block, poor sleep. A Poor reading is a longer-term pattern sitting below typical norms for your age, which is a reasonable prompt to mention to a doctor at your next visit, rather than something to try to fix with one good night’s sleep.
Note: If your status seems stuck on Unbalanced or Low even though you feel fine, check when your baseline was set. A baseline built during an unusually restful stretch (a vacation, an off-season) can sit higher than your normal range, making ordinary training look “unbalanced” by comparison. Garmin’s baseline is dynamic and typically recalibrates over several weeks of normal routine.
What Changes Garmin HRV Status?
Changes in Garmin HRV Status typically reflect a mix of training load, sleep quality, stress, and overall health, with sudden declines often signaling overtraining, inadequate recovery, or elevated stress. Status shifts are measured nightly during sleep, so reliable patterns require consistent wear. Training intensity, poor sleep quality, and rising stress can lower readings, while healthy habits tend to support steadier values. Individual variation matters too: age, genetics, and lifestyle shape each baseline, so one athlete’s normal may be another’s anomaly. Regular review of your own data — rather than a single night’s number — is what helps separate noise from a meaningful change.
| Factor | Effect |
|---|---|
| Training intensity | Can suppress HRV status temporarily |
| Sleep quality | Poor sleep often reduces readings |
| Stress levels | Higher stress tends to lower HRV |
| Healthy habits | Support more stable trends |
| Individual variation | Defines each person’s normal range |
HRV Status also sits alongside other Garmin metrics that draw on the same physiological data — Training Readiness, Body Battery, and Recovery Time. When several of these point the same direction (say, Low HRV status plus low Body Battery plus a long Recovery Time), that’s a stronger signal than any one metric alone.
How Can You Improve Garmin HRV Status?
Improving Garmin HRV Status generally comes down to strengthening recovery inputs and reducing physiological strain: consistent 7–9 hour sleep, a sensible mix of aerobic and anaerobic training, effective stress management, adequate hydration, and balanced nutrition all support healthier autonomic function and steadier readings.
The best lever isn’t maximal effort — it’s consistency. Garmin users typically see their average HRV rise when quality sleep is protected, training load increases gradually, and recovery days are actually respected rather than skipped.
Consistency beats maximal effort: protected sleep, progressive training, and real recovery days help HRV trend upward over weeks, not overnight.
Stress management matters because autonomic balance shifts once the body exits a chronic alert state. Hydration and whole-food nutrition reduce avoidable biological drag on top of that.
- Regular exercise: mix endurance and strength work; avoid stacking hard sessions back to back.
- Quality sleep: keep bedtimes steady so recovery becomes measurable night to night.
- Hydration: correct fluid loss early, especially after heat or heavy sweat.
Warning: Don’t chase a single night’s HRV number — one late night, one drink, or one hard session can swing it without meaning much. Judge trends over the 7-day and 4-week views instead, and give any lifestyle change at least two to three weeks before expecting the baseline itself to move.
When HRV status trends low, dialing back training intensity until your average stabilizes tends to pay off later — a short step back usually costs less than pushing through and needing a longer recovery afterward.
Frequently Asked Questions
What is a good HRV range on Garmin?
There isn’t a single “good” number — a good range is whatever sits inside your own personal baseline, which Garmin builds after about three weeks of consistent overnight wear. Two people can have very different absolute HRV values and both be perfectly healthy; what matters is whether your own 7-day average stays inside your own range, and whether that range holds steady or trends downward over weeks and months.
What is a good HRV range for my age?
HRV naturally declines with age in most people, and published clinical reference values reflect that: overnight RMSSD readings tend to run higher in the 20s and 30s and gradually lower from midlife onward. Garmin doesn’t publish its own exact age cutoffs, and clinical norms vary by measurement method, so treat any age-based chart as general context rather than a personal target — your own baseline trend is the number worth watching.
What do cardiologists say about HRV?
Cardiologists generally view HRV as a useful window into autonomic nervous system function and recovery, with lower HRV over time associated with higher stress load and, in some studies, cardiovascular risk. That said, consumer wrist-based HRV is a wellness signal, not a diagnostic test, and clinicians typically want to see a sustained trend — not a single reading — before it changes any recommendation. If your Poor status persists for weeks, it’s a reasonable thing to mention at a routine check-up.
Is an HRV of 39 ms considered good?
On its own, 39 ms doesn’t tell you much — it could be a perfectly normal reading for an older adult and a below-average one for someone in their twenties, and the number also shifts depending on measurement method and device. What actually matters is whether 39 ms sits inside or outside your own established baseline. A single reading is far less informative than whether your 7-day average is holding steady, rising, or trending down.
Conclusion
In Garmin’s HRV Status, the nightly number is less a verdict than a signal. Compared with your personal baseline, it can suggest recovery, strain, or steadiness — a quiet read on what’s happening beneath the surface. Trends matter far more than any single reading. Sleep, training load, stress, alcohol, and illness can all shift the range temporarily, but consistent habits tend to bring it back. Used this way — as a trend to watch rather than a score to chase — HRV status becomes a practical, evidence-based guide for everyday training and recovery decisions, not a mystery and not a diagnosis.
Sources
- Garmin Owner’s Manual — Heart Rate Variability Status — official description of the four status labels, baseline requirements, and No Status condition
- Garmin — Understanding HRV Status — Garmin’s own technical explainer on overnight measurement and five-minute averaging windows
- Garmin Blog — Understanding the HRV Status on Your Garmin Smartwatch — plain-language guidance on interpreting baseline shifts
- Garmin Newsroom — Garmin Acquires Firstbeat Analytics — background on the physiological-analytics technology behind HRV Status
- Frontiers in Physiology — Normal Values of Heart-Rate Variability for All Ages — peer-reviewed reference ranges for RMSSD by age group
