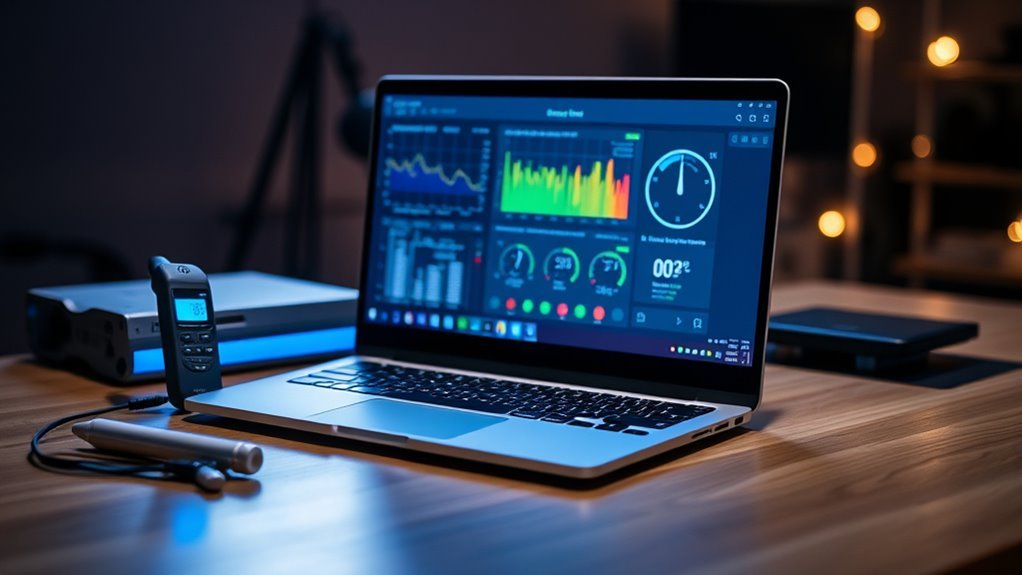
Checking your laptop’s temperature in real time means watching live CPU and GPU sensor readings while you work, instead of guessing from fan noise or a hot keyboard. The fastest way to check laptop temperature in real time is a free monitoring app like HWMonitor, Core Temp, or HWiNFO, backed up by the thermal tools your laptop maker already installed. This guide covers both, plus what counts as a safe temperature and how to cool a laptop down when it runs hot.
Quick Answer
Open Windows Task Manager’s Performance tab for a quick GPU temperature check, or install HWMonitor, Core Temp, or HWiNFO for detailed live CPU and GPU readings. Most laptop brands also include their own thermal software — Dell Power Manager, Lenovo Vantage, HP CoolSense/Command Center, or ASUS Armoury Crate — which shows thermal status and lets you switch cooling modes.
Key Takeaways
- Windows Task Manager’s Performance tab shows GPU temperature on most laptops, but it does not show CPU temperature.
- Free apps like HWMonitor, Core Temp, and HWiNFO give live, per-core CPU and GPU readings, and HWMonitor can also report battery temperature.
- Laptop-maker software — Dell Power Manager, Lenovo Vantage, HP CoolSense, ASUS Armoury Crate — lets you see thermal status and switch between quiet and performance cooling modes.
- Sustained CPU temperatures near a processor’s thermal limit trigger throttling, which Intel and AMD both build in to protect the chip rather than let it fail.
- A laptop’s thin chassis gives cooling less room to work with than a desktop tower, so blocked vents, dust, and aging thermal paste cause overheating faster.
How to Check Laptop Temperature in Real Time

Real-time laptop temperature monitoring works by reading the digital thermal sensors built into the CPU and GPU and refreshing the display continuously while the system runs. Tools such as HWMonitor and Core Temp expose live per-core CPU readings alongside GPU temperature, so you can watch heat climb the moment a demanding app or browser tab starts working the processor.
Windows Task Manager also shows basic GPU temperature under its Performance tab on most systems, a legacy of the May 2020 Windows update, which makes it a fast check when you don’t want to install anything — though it stops short of showing CPU temperature.
Because a laptop’s cooling system has far less room to work with than a desktop tower, keeping an eye on live readings is one of the more reliable ways to catch a problem, such as a blocked vent or a failing fan, before it causes thermal throttling or an unexpected shutdown.
Built-In Laptop Manufacturer Tools
Before installing third-party software, check the utility your laptop maker already shipped. These tools are tuned to your exact model’s fan curve and power limits, so they’re usually the most accurate starting point for real-time thermal status.
Dell Power Manager
Dell Power Manager (part of Dell Command | Power Manager and Dell Optimizer) includes a Thermal Management panel with four modes. Optimized balances performance, noise, and temperature. Cool raises fan speed to keep the exterior surface cooler, at the cost of more noise. Quiet slows the fan and processor to cut noise, which can let temperature rise. Ultra Performance raises processor and fan speed for maximum performance, with more noise and heat as a trade-off; on supported systems it can be toggled directly with Fn+T.
Lenovo Vantage Thermal Mode
On Lenovo laptops, including ThinkPad and Legion models, Vantage exposes thermal or performance mode settings — commonly labeled Quiet, Balanced, and Performance — that adjust the fan curve and power limits together. A quieter mode trades a warmer chassis for less fan noise, while a performance mode runs the fans harder to keep temperatures lower under sustained load.
HP CoolSense and Command Center
HP CoolSense uses a motion sensor built into supported notebooks to detect whether the laptop is sitting still or being carried, then automatically adjusts fan speed and performance to manage heat. Newer HP laptops handle similar thermal and performance settings through HP Command Center or HP Support Assistant.
ASUS Armoury Crate (Fan Xpert)
ASUS laptops with Armoury Crate include Fan Xpert, which detects the system’s fans and offers preset modes — Silent, Standard, Turbo, and Full Speed — or a custom fan curve tied to a chosen temperature source, giving direct control over how aggressively the laptop cools itself.
Check Laptop Temperature in Windows
In Windows, open Task Manager with Ctrl + Shift + Esc and select the Performance tab to see GPU temperature on most laptops. Task Manager does not display CPU temperature, so for live CPU readings you need a dedicated tool such as Core Temp or HWMonitor, both of which read the processor’s built-in digital thermal sensor directly.
Some laptops also expose a thermal zone through PowerShell’s WMI interface, though support varies by manufacturer and the values aren’t always reliable, so a purpose-built monitoring app remains the more consistent option.
Check Laptop Temperature on macOS and Linux
On a MacBook, Activity Monitor’s CPU tab shows processor load but not temperature directly. For an actual reading, iStat Menus or Macs Fan Control report real-time CPU and GPU temperatures and, on Intel-based Macs, allow manual fan-speed adjustment. Fanless models such as the MacBook Air have no active cooling at all, so they throttle sooner under sustained load than fan-equipped MacBook Pro models.
On a Linux laptop, installing lm-sensors and running sensors in a terminal returns live temperature readings from the CPU and other detected components.
Best Real-Time Monitoring Apps for Laptops
Several third-party apps monitor laptop temperature in real time, each with a different focus. HWMonitor reads voltages, temperatures, fan speeds, and clock speeds across the CPU, GPU, and storage, and can also report battery thermal information — useful on a laptop where the battery sits close to other hot components. Core Temp is a lightweight, per-core CPU reader built on the processor’s digital thermal sensor, which keeps overhead low on a thin laptop. HWiNFO adds deeper diagnostics, customizable alerts, and on-screen display overlays for users who want more detail. NZXT CAM provides a simpler dashboard view with live metrics, which suits users who just want a glance at CPU and GPU heat.
| App | Strength | Best For |
|---|---|---|
| HWMonitor | Broad sensor coverage, incl. battery | General laptop monitoring |
| Core Temp | Lightweight, per-core CPU data | Low-overhead tracking |
| HWiNFO | Deep diagnostics, alerts | Advanced users |
| NZXT CAM | Simple dashboard overlay | Quick at-a-glance checks |
Safe Laptop Temperature Ranges
Neither Intel nor AMD publishes one universal “safe” number, because the ceiling depends on the specific chip. Instead, each processor has a maximum junction temperature — Intel calls it Tjunction max, typically somewhere between 100°C and 110°C depending on the model — at which point the chip throttles its clock speed to hold that limit rather than keep heating up. Intel notes that running at that ceiling under a heavy workload “isn’t necessarily cause for concern,” since the processor is designed to manage it automatically; it also points out that on laptops, the exact power and thermal limits are set by the laptop maker, not by Intel or AMD directly.
In everyday terms, most laptop CPUs idle in the 35–50°C range and commonly run 70–90°C under gaming or heavy multitasking in a thin chassis, since OEMs often tune laptops to use most of the available thermal headroom for performance. What matters more than a single number is whether the temperature keeps climbing without leveling off, or whether performance drops noticeably once it gets there — both point to throttling.
Warning: If a laptop shuts down unexpectedly under load or repeatedly hits its thermal limit, stop running it under heavy workloads until the vents are cleaned or it has been serviced. Repeated overheating can degrade the battery and shorten the life of internal components.
What Causes a Laptop to Overheat?
Laptop overheating usually comes down to airflow, dust, or a workload that exceeds what the chassis was designed to dissipate.
Vent Blockage and Dust
Dust buildup in the intake and exhaust vents restricts airflow and lets internal temperatures climb. It gets worse when the laptop sits on a bed, couch, or lap, since soft surfaces block the vents on the underside of the chassis. Placing the laptop on a hard, flat surface and cleaning the vents periodically restores airflow and helps keep temperatures in a normal range.
Aging Thermal Paste
Thermal paste between the CPU and its heatsink degrades over years of heat cycles, transferring heat less efficiently and gradually raising baseline temperatures even under the same workload.
Note: Opening a laptop to reapply thermal paste can void the manufacturer’s warranty on many models. Check your warranty terms first, or have an authorized service center handle it.
Heavy Workloads in a Thin Chassis
Gaming, video editing, and other sustained CPU- or GPU-heavy tasks push a laptop toward its thermal limit faster than a desktop with more physical space for heatsinks and airflow. When several demanding applications run at once, temperatures can climb into throttling territory well before a desktop equivalent would.
How to Cool a Laptop Fast
Start by moving the laptop to a hard, flat surface so the intake vents underneath aren’t blocked. Close unnecessary background applications and browser tabs to cut CPU demand, then watch a real-time monitoring app to confirm the temperature is actually dropping rather than assuming it from fan noise alone.
If the laptop has a vendor thermal mode, switching to a cooler or quieter setting (Dell’s Cool mode, Lenovo’s Quiet mode, or similar) can bring temperatures down immediately, though performance may dip slightly as a trade-off.
Pro Tip: Independent testing of laptop cooling pads shows mixed results — some drop CPU temperature by only a few degrees, because the real bottleneck is the intake vents on the laptop’s underside, not the surrounding air. If you use one, make sure it doesn’t cover or restrict those vents.
Pro Tip: Check your laptop’s built-in vendor app for a Quiet or Cool mode before installing third-party fan-control software. It’s already tuned to your specific model’s hardware limits.
Frequently Asked Questions
How Do I Check My Laptop’s Temperature in Real Time?
Open Windows Task Manager’s Performance tab for a quick GPU reading, or install HWMonitor, Core Temp, or HWiNFO for live CPU and GPU temperatures. On Mac, use iStat Menus or Macs Fan Control; on Linux, use lm-sensors.
What Is a Normal Laptop CPU Temperature?
Most laptop CPUs run 35–50°C at idle and 70–90°C under gaming or heavy multitasking. Because laptop chassis run closer to their thermal limit than desktops, this range is normal rather than a sign of trouble on its own.
Is 120°F Hot for a Laptop CPU?
No. 120°F is about 49°C, which is a normal idle-to-light-load temperature for most laptop CPUs and well below the point where thermal throttling begins.
How Do I Know If My Laptop Is Overheating?
Watch for sudden performance drops during demanding tasks, a fan running at full speed continuously, a chassis that’s hot to the touch, or CPU temperatures holding above roughly 90°C. Any of these, especially combined with an unexpected shutdown, points to overheating.
Does a Laptop Cooling Pad Actually Lower Temperature?
It depends on the laptop and the pad. Some models see only a small drop because the pad doesn’t improve airflow at the actual intake vents. A pad tends to help more on laptops with bottom-mounted intakes that benefit from extra clearance and elevation.
Conclusion
Real-time thermal monitoring keeps a laptop within the safe range its manufacturer designed for, since sustained temperatures near the thermal limit trigger throttling or, in prolonged cases, hardware wear. If a gaming laptop reaches 95°C during a demanding session, a monitoring app reveals the spike immediately, giving you the chance to switch cooling modes or reduce the load. Checking temperature in Windows, macOS, Linux, or through your laptop maker’s own app supports both steady performance and a longer hardware lifespan.
Last checked: September 2026, against current vendor and manufacturer support documentation.
Sources
- Intel – What Is Throttling and How Can It Be Resolved?
- AMD – Troubleshooting CPU Performance and Temperature Issues
- Dell – Power Manager Thermal Management Guide
- Lenovo – ThinkPad Thermal Performance Overview
- HP – CoolSense Technology
- ASUS – Introduction to Fan Xpert 4 in Armoury Crate
- CPUID – HWMonitor
- Core Temp (ALCPU)
