Quick Answer
On a desktop PC, install a free monitoring tool such as Core Temp, HWMonitor, or HWiNFO to see live CPU and GPU temperatures, since Windows Task Manager only shows GPU temperature (not CPU temperature) on most systems. For a check without installing anything, restart the PC, enter the BIOS/UEFI setup (commonly Del, F2, or F10 during boot), and open the Hardware Monitor or PC Health Status screen built into the motherboard firmware.
Key Takeaways
- Windows Task Manager shows GPU temperature on most systems, but it does not show CPU temperature.
- Free tools like Core Temp, HWMonitor, and HWiNFO give real-time CPU and GPU readings on a desktop.
- Desktop motherboards expose a Hardware Monitor screen inside the BIOS/UEFI setup, which laptop firmware rarely shows in the same detail.
- There is no single “safe” number for every chip — each CPU and GPU model has its own maximum temperature listed on the manufacturer’s official spec page.
- Case airflow, dust buildup, and thermal paste condition matter more on a desktop tower than they do on a sealed laptop chassis.
Does Windows Show PC Temperature by Default?
Windows does not give a full temperature readout out of the box, and what it does show depends on the component. In the Performance tab of Task Manager, most systems with a supported graphics driver will display GPU temperature directly. CPU temperature, however, is not shown in Task Manager on any current version of Windows.
The reason comes down to how the two components report heat. GPU temperature is exposed through a fairly standardized graphics-driver interface, so Windows can read it consistently across brands. CPU temperature reporting is far less consistent — Intel and AMD label and expose their sensors differently (for example, AMD chips report a “Tctl/Tdie” value that is not always the literal physical die temperature), and Windows has no single reliable way to identify and label the “correct” sensor across every motherboard and chipset combination. That inconsistency is why Microsoft has not built native CPU temperature monitoring into Task Manager.
The practical result for a desktop PC: check GPU temperature in Task Manager if you just need a quick number, but use a dedicated monitoring tool or the motherboard’s own BIOS/UEFI screen for CPU temperature.
How to Check Desktop PC Temperature With Software
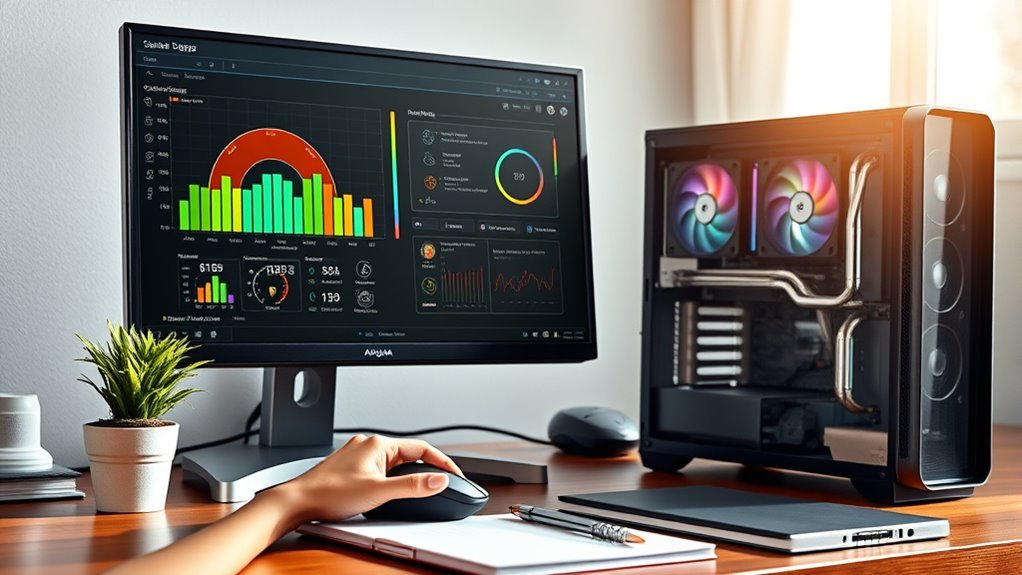
Several free, well-established Windows utilities read the temperature sensors built into a desktop’s CPU, GPU, and motherboard and display them in real time:
- Core Temp — a lightweight tool focused specifically on per-core CPU temperature, minimum/maximum tracking, and load percentage.
- HWMonitor (CPUID) — reads CPU, GPU, motherboard, and drive temperatures alongside voltages and fan speeds in one window.
- HWiNFO — a more advanced sensor suite that covers nearly every temperature, voltage, and clock-speed sensor on a desktop motherboard, plus logging for tracking trends over time.
- MSI Afterburner — built primarily for GPU monitoring and overclocking, and it works with most desktop graphics cards regardless of brand, not just MSI models.
After installing one of these, open it and look at the current CPU and GPU readings alongside their recorded minimum and maximum values. On a desktop, it’s worth checking both idle (nothing running) and load (a game or render running) readings, since a healthy desktop tower typically shows a noticeably lower number at idle than under sustained load.
Pro Tip
Cross-check readings between two tools (for example HWiNFO and the GPU vendor’s own software) before assuming a number is wrong. Different tools sometimes label the same physical sensor differently, and a second reading confirms whether the temperature — not the tool — is the issue.
How to Check Desktop PC Temperature in BIOS/UEFI
A desktop PC’s motherboard firmware exposes its own hardware monitoring screen without needing to boot into Windows at all, which makes it a useful no-install way to spot-check temperatures:
Accessing the BIOS/UEFI on a Desktop
Restart the computer and press the manufacturer’s setup key during the initial boot screen — commonly Delete or F2, though some boards use F10 or Esc. The exact key is usually shown briefly on screen during boot, or listed in the motherboard’s manual.
Once inside, look for a section labeled Hardware Monitor, PC Health Status, or something similar depending on the motherboard brand (ASUS, MSI, Gigabyte, and ASRock each use slightly different menu names and layouts for this screen).
Reading the Hardware Monitor Screen
This screen typically lists CPU temperature, motherboard/chipset temperature, fan speeds, and sometimes VRM temperature, all as a single idle snapshot — the system isn’t under any real load while you’re sitting in the BIOS. That makes it useful for a quick sanity check, but it can’t show what happens once a game, render, or benchmark pushes the CPU or GPU under sustained load.
This is also an area where desktop PCs differ meaningfully from laptops: most desktop motherboards give a fairly detailed Hardware Monitor page as a matter of course, since it’s the board manufacturer’s own firmware with room for a full sensor page, whereas many laptop BIOS/UEFI implementations are more limited or skip a temperature readout entirely.
Note
Menu names and the exact path to the Hardware Monitor screen vary by motherboard brand and BIOS version. If it isn’t visible immediately, check the “Advanced” or “Monitor” menu, or consult the motherboard’s manual for the precise location.
Normal and Safe Temperature Ranges for a Desktop CPU and GPU
There is no single number that applies to every desktop CPU or GPU — the real ceiling is model-specific, and both Intel and NVIDIA explicitly point users to their own spec pages rather than a universal figure:
- Intel states that its processors have a “Tjunction Max” — the thermal limit at which the chip starts throttling to protect itself — that is usually somewhere between 100°C and 110°C, and it varies by processor model. Intel also notes that running near this limit under a heavy, sustained workload is expected behavior, not necessarily a sign of a problem. To find the exact figure for a specific chip, search the processor on Intel’s ARK database and check the “Package Specifications” section for Max Operating Temperature, Tjunction, or Tcase.
- AMD desktop Ryzen CPUs report a “Tctl/Tdie” value, and each model has its own maximum safe temperature (often called Tjmax) set by AMD for that specific chip. The Ryzen Master utility displays this alongside live readings, and it’s the most reliable way to see the limit that actually applies to your CPU.
- NVIDIA confirms that maximum operating temperature varies by GPU model, and directs users to the specific card’s product page on nvidia.com for that figure rather than a single number for all GPUs. If a GPU reaches its limit, the driver automatically reduces clock speed to cool it down, and the system shuts down if temperatures keep climbing despite that throttling.
As a general, non-model-specific pattern reported widely across desktop builds: idle temperatures often land somewhere in the 30s to 50s °C range, and load temperatures commonly rise into the 60s–80s °C range depending on the cooler, case airflow, and workload. Treat these as a loose sanity check only — the number that actually matters is the maximum for your exact CPU or GPU model, found on the manufacturer’s own spec page.
Warning
If a component is repeatedly hitting its manufacturer-listed maximum temperature under normal (non-overclocked) use, or the system is shutting down unexpectedly under load, stop pushing the hardware and address cooling before continuing — automatic throttling and shutdown exist specifically to prevent damage, but relying on them as a regular safety net can still shorten component life.
Signs Your Desktop PC Is Overheating
A few practical warning signs are worth watching for on a desktop tower:
- Noticeable performance slowdowns or stuttering that appear only during demanding tasks (games, renders, exports).
- Sudden crashes, freezes, or restarts that happen specifically under load rather than at idle.
- Case or CPU fans running at consistently high, audible speeds even during lighter tasks.
- Monitoring software reporting sustained readings close to the CPU’s or GPU’s manufacturer-listed maximum.
A monitoring tool such as Core Temp, HWMonitor, or HWiNFO is the most direct way to confirm whether any of these symptoms line up with an actual temperature spike rather than a different underlying issue.
How to Lower Desktop PC Temperature
If temperatures are consistently running high, a few desktop-specific fixes typically help, roughly in order of effort:
| Step | Action | Why it helps |
|---|---|---|
| 1 | Clean dust from case fans, the CPU cooler, and the GPU heatsink | Dust buildup blocks airflow and insulates heat-generating surfaces |
| 2 | Check case fan layout and cable routing | Proper intake/exhaust balance and clear airflow paths reduce trapped heat inside the case |
| 3 | Reapply thermal paste on the CPU (roughly every 2–3 years) | Dried-out paste loses its ability to transfer heat to the cooler |
| 4 | Verify all fans (case and cooler) are actually spinning and set to an appropriate curve | A stalled or misconfigured fan can’t move the heat it’s meant to move |
| 5 | Upgrade the CPU cooler (larger air tower or closed-loop liquid cooler) if the current one is undersized | Stronger cooling capacity directly lowers sustained-load temperatures |
Because a desktop tower has room for multiple case fans, larger heatsinks, and liquid cooling that a laptop chassis simply can’t fit, these hardware-level fixes tend to have more headroom on a desktop than on a laptop.
Tracking Desktop PC Temperature Over Time
To spot patterns rather than one-off spikes, log readings over time using a tool like HWiNFO’s built-in logging feature, which can record CPU, GPU, and motherboard sensors continuously while the desktop is used normally. Reviewing logged idle, gaming, and sustained-load readings over a few sessions makes it much easier to tell whether a system is running consistently within its normal range or trending upward — for example after new dust buildup or a change in ambient room temperature.
Frequently Asked Questions
How do I check the temperature of my desktop PC?
Install a free monitoring tool such as Core Temp, HWMonitor, or HWiNFO to see live CPU and GPU readings in Windows, or restart the PC and open the Hardware Monitor / PC Health Status screen in the BIOS/UEFI setup for a quick, no-install snapshot.
Does Windows Task Manager show CPU temperature on a desktop PC?
No. Task Manager’s Performance tab shows GPU temperature on most systems, but it does not display CPU temperature on any current version of Windows, because CPU sensors are reported inconsistently across different chip makers and motherboards.
What is a normal CPU temperature for a desktop PC?
There’s no single figure that fits every chip. Intel states its processors have a Tjunction Max usually between 100°C and 110°C, varying by model, and AMD sets its own per-model limit (Tjmax) shown in Ryzen Master. Check your exact CPU model’s spec page (Intel ARK or AMD’s product page) rather than relying on a generic number.
Is 90°C bad for a desktop CPU?
Not necessarily — it depends on the specific CPU model and its manufacturer-listed maximum. Some desktop CPUs are designed to run near the high end of their range under heavy sustained load without damage, since built-in throttling and shutdown protections exist precisely to prevent overheating damage. If 90°C is close to or at your CPU’s specific Tjunction Max / Tjmax, that’s a signal to improve cooling rather than ignore it.
How do I check my desktop’s GPU temperature?
Check the GPU tile in Windows Task Manager’s Performance tab for a quick reading, or use a dedicated tool like MSI Afterburner, HWMonitor, or HWiNFO for a more detailed, real-time view alongside clock speed and fan data.
Conclusion
Checking a desktop PC’s temperature comes down to two reliable options: a free monitoring tool like Core Temp, HWMonitor, or HWiNFO for live CPU and GPU readings in Windows, or the motherboard’s own Hardware Monitor screen in the BIOS/UEFI for a quick snapshot without installing anything. Since Windows itself only shows GPU temperature by default, one of these two routes is the only way to see what the CPU is actually doing. From there, compare readings against the specific maximum listed for your exact CPU and GPU model rather than a generic number, and address airflow, dust, and cooling if temperatures are consistently pushing that limit.
