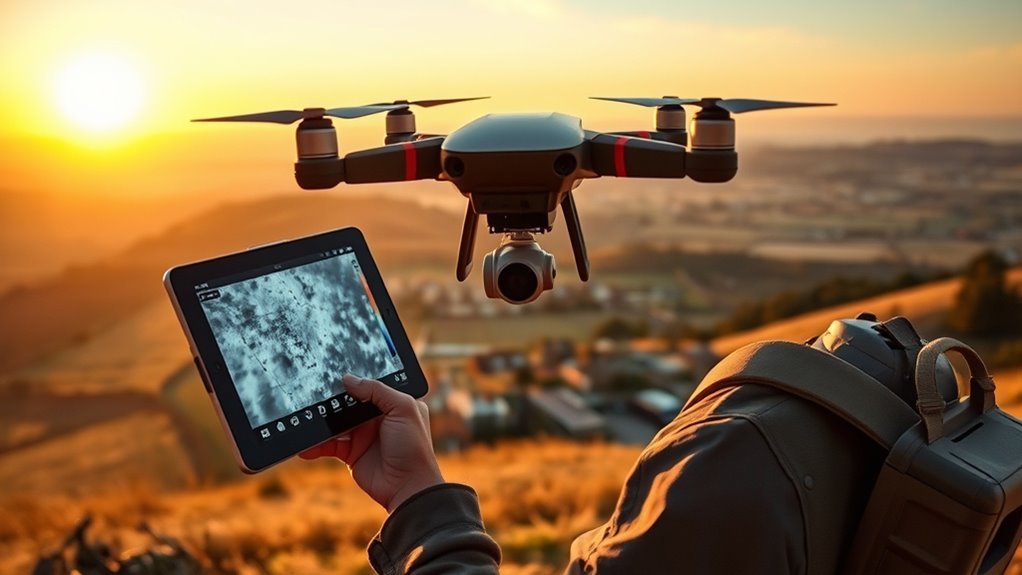
Thermal drone mapping combines overlapping infrared imagery with careful flight planning to produce georeferenced temperature data. Camera resolution, sensor sensitivity, and radiometric output determine how much detail survives processing. Flight rules remain strict, with line of sight and altitude limits shaping every mission. Even with good capture settings, poor overlap or weak calibration can distort results. The real value emerges when temperature anomalies are measured correctly, not merely seen.
What Thermal Drone Mapping Is
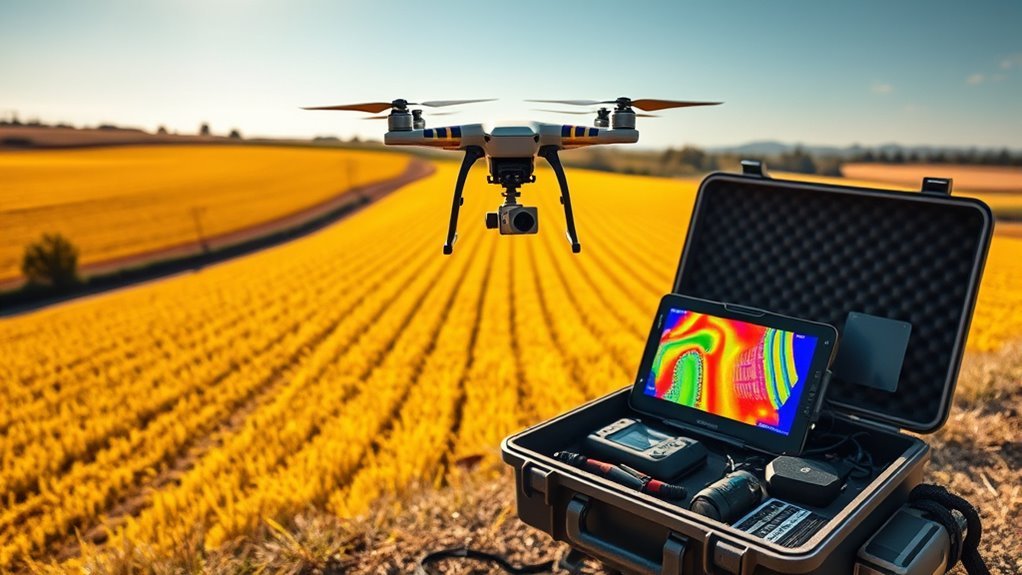
Thermal drone mapping is the process of capturing overlapping infrared images from an unmanned aircraft and stitching them into a georeferenced temperature map.
Thermal drone mapping stitches overlapping infrared images into a georeferenced temperature map.
In practice, thermal mapping differs from standard thermal imaging because it produces repeatable survey products rather than a live view or isolated frame. A thermal imaging drone follows planned flight paths with high overlap, often near 90 percent, so the overlapping infrared photos can be mosaicked accurately.
The result is two outputs: a colorized thermal mosaic for quick review and a radiometric thermal camera dataset that preserves temperature measurements. Those measurements support thermal analysis, yet absolute values depend on emissivity settings, camera calibration, and ambient conditions.
Reliable temperature differences are usually more useful than single-point readings. Compliance with standards such as ASTM C1153 helps define flight timing and conditions, improving survey consistency.
Proper execution gives technicians clear, actionable data and greater control over concealed energy loss.
Choose the Right Thermal Drone Camera
Selecting the right thermal drone camera begins with matching sensor performance to the mission, since resolution, radiometric capability, and platform compatibility directly affect data quality. A thermal drone configured well can deliver radiometric data that supports defensible decisions rather than guesswork.
- Resolution matters: a 640×512 camera such as the H20T reveals fine heat patterns that improve analysis.
- Compatibility matters: the Mavic 3 Enterprise Thermal supports RGB and thermal capture, while the Mavic 2 Enterprise Dual is not suited for radiometric capture.
- Sensitivity matters: NETD and related thermal sensitivity figures influence temperature readings and the reliability of measured anomalies.
Dual-camera payloads improve situational awareness by pairing visible and infrared views in one pass.
For operations demanding precise temperature readings, radiometric processing should be nonnegotiable. The camera should serve the mission, not constrain it, allowing users to work with clearer evidence and greater operational freedom.
Thermal Flight Rules That Matter
Flight rules shape whether thermal data is usable at all: operators must stay within FAA limits, maintain line of sight, and generally remain below 400 feet AGL. For Thermal drone flight, compliance is not bureaucracy; it protects data accuracy and lawful access to infrared mapping.
| Rule | Practical effect |
|---|---|
| Line of sight | Keeps control and situational awareness |
| 400 ft AGL limit | Reduces airspace conflict |
| Night lighting | Enables legal flight, with anti-collision lights under Part 107 or green flashing light in the EU |
Night operations can be legal and often improve temperature contrast for thermal images, especially after sunny days on roofs. Standards such as ASTM C1153 and IEC TS 62446-3 support reliable survey conditions. High-overlap capture is also essential: at least 90% front and side overlap helps preserve detail, strengthen compliance, and support disciplined mapping. The result is more freedom through precision, not guesswork.
Plan Flights for Clean Thermal Maps
Careful flight planning is the difference between a clean thermal map and a noisy one. For drones used in thermal mapping, the mission should be timed for strong temperature differences, often at night after sunny days, so thermal imagery reveals defects clearly and workers gain usable insight.
- Set front and side overlap to at least 90% to protect data accuracy and reduce motion blur.
- Record flight altitude and camera settings before launch, so processing remains consistent and repeatable.
- Use dual-sensor payloads when context is needed, while keeping the thermal survey aligned with ASTM C1153 and IEC TS 62446-3.
These choices support disciplined collection, clearer interpretation, and fewer gaps in coverage. When flight paths are planned with precision, thermal mapping becomes a reliable tool for inspection teams seeking practical, independent evidence.
Capture RGB and Thermal Data Together
With the flight path already set for high-overlap coverage, the next step is to capture RGB and thermal data together so the survey has both visual context and temperature detail.
Dual-camera drones, such as the Mavic 3 Enterprise Thermal, support simultaneous capture of RGB and thermal images, reducing pass count and preserving alignment between layers. In the camera settings, operators should enable both Infrared and Visible modes before takeoff.
During flight, the Camera Toggle feature helps confirm that each asset is being viewed in RGB and thermal data as needed, improving inspection efficiency.
For thermal mapping, at least 90% overlap in thermal images is recommended so the stitched output maintains consistent coverage. The collected thermal data can then be processed into radiometric maps, giving measurable temperature values at specific locations.
This workflow supports clear, independent assessment of buildings, equipment, and energy use.
What Radiometric Thermal Data Shows?
Radiometric thermal data converts infrared imagery into measurable temperature values, allowing a survey to show not just where heat differences exist, but how much they differ across the scene. It turns thermal cameras into tools for exact temperature measurements, revealing heat variations and temperature patterns that standard images cannot quantify.
Radiometric thermal data turns infrared imagery into measurable temperatures, revealing not just heat differences, but their exact magnitude.
A radiometric TIFF from the flight preserves scene data for compatible processing software, which calculates temperature differences at each pixel and improves inspection capabilities.
- Specific anomalies can be measured against surrounding surfaces.
- Emissivity, reflected temperature, and environment affect measurement accuracy.
- Documented readings support maintenance decisions with defensible evidence.
This method enables operators to evaluate assets without guesswork, making thermal findings actionable and transparent.
For teams pursuing practical autonomy, radiometric thermal data offers a direct route from infrared capture to verified temperatures, reducing uncertainty while preserving technical rigor.
Process Thermal Maps Without Losing Temperature Data
Processing thermal maps without losing temperature data requires radiometric capture in formats such as R-JPEG or radiometric TIFF, since these preserve per-pixel temperature values.
Accurate results depend on correct emissivity and reflected temperature settings during acquisition, along with tightly controlled flight overlap to reduce blur and support reliable mapping.
Thermal map processing should be completed in software designed to retain radiometric data, while flight conditions and sensor settings are documented for proper interpretation.
Radiometric Capture Requirements
Reliable thermal mapping begins with the right capture setup: a compatible radiometric camera such as the DJI Matrice 300 RTK with H20T must record temperature data at the source so the imagery can later be processed into maps that preserve true thermal values.
Radiometric capture depends on thermal sensors, temperature data embedded, and disciplined flight planning.
- Set emissivity settings for each surface before takeoff.
- Capture thermal images with 90% overlap to prevent gaps and reveal temperature variations.
- Use Thermal Analysis Tool 3 for batch review and parameter correction after flight.
This workflow supports precise inspection of buildings, utilities, and energy systems.
When executed correctly, it gives operators liberated access to measurable heat patterns instead of vague color gradients, enabling confident decisions from raw data.
Preserve Temperature Accuracy
Preserving temperature accuracy starts with proper sensor calibration and emissivity selection matched to the surveyed material, so the thermal map retains usable measurement data after processing.
Thermal drones should be calibrated before each mission, and radiometric thermal maps should be preferred because they preserve numeric temperature values, not just color contrast.
Correct emissivity settings, reflected temperature input, and documented humidity help protect accuracy across changing atmospheric conditions.
Consistent flight parameters, including altitude and speed, reduce motion blur and limit false temperature difference in the capture.
For practical thermal analysis, batch tools such as DJI Thermal Analysis Tool 3 can adjust parameters while keeping the data measurable.
This approach supports clear, defensible inspection work and helps operators work free from guesswork, preserving temperature truth rather than visual approximation.
Thermal Map Processing
Thermal map processing begins with overlapping infrared images that must be aligned and georeferenced carefully so the final product reflects true spatial relationships and usable temperature data.
In thermal map processing, radiometric processing preserves measurements from DJI thermal cameras, especially R-JPEG files, so each pixel retains temperature data rather than a false color only.
Accurate results depend on correct emissivity and reflected temperature settings before and during capture. A thermal analysis tool can then batch-adjust parameters and streamline workflows without stripping radiometric values.
- Align overlapping infrared photos with georeferencing.
- Verify emissivity and reflected temperature.
- Export radiometric outputs for thermal analysis.
This disciplined process gives operators reliable thermal maps, clearer decisions, and greater autonomy in field assessment.
Read Hot and Cold Spots Correctly
When interpreting thermal drone maps, operators must distinguish true hot and cold spots from artifacts created by sensor settings and surface reflectivity.
Thermal imaging detects infrared radiation, but useful judgment depends on camera calibration, emissivity selection, and thermal sensitivity. On radiometric thermal maps, measurable temperature readings help reveal whether a heat signature is real or distorted. Strong thermal contrast makes anomalies easier to read; weak contrast can hide them.
Field crews should favor flight conditions that support clean separation, such as dry, sun-warmed roofing scanned after solar loading has stabilized. Reflective surfaces, including metal, glass, and water, can redirect energy and mislead analysis, so each reading must be treated as conditional, not absolute.
Practical interpretation requires checking whether the apparent hot and cold spots fit the material, the environment, and the mission goal. This disciplined reading supports safer decisions, clearer maintenance priorities, and greater control over inspection work.
Compare Thermal Maps Side by Side
Side-by-side comparison of thermal and visible-light maps helps operators connect temperature anomalies with the physical features that produce them, improving interpretation across large sites.
In drone inspections, thermal maps from a visible camera and radiometric thermal maps from a DJI Matrice platform support disciplined data interpretation by pairing geometry with temperature readings. This approach is especially useful when a thermal analysis tool is used to review layered outputs and confirm whether a signal reflects equipment, roofing, vegetation, or terrain.
- Match each anomaly to its physical context before drawing conclusions.
- Use radiometric thermal maps to verify measurable temperature readings, not only color gradients.
- Compare repeated passes to separate stable patterns from transient conditions.
Radiometric thermal maps are more informative than colorized mosaics because they preserve numerical values for review.
Radiometric thermal maps preserve numeric values, making them more useful for review than colorized mosaics.
With careful side-by-side comparison, teams gain clearer evidence, better prioritization, and more freedom from guesswork during thermal analysis.
Common Thermal Mapping Mistakes to Avoid
Common thermal mapping errors often trace back to poor flight planning and incomplete data validation. In thermal mapping, a commercial drone must maintain 90% front and side overlap to prevent gaps in data and preserve map fidelity.
Operators who ignore environmental conditions such as humidity, atmospheric conditions, and reflective surfaces risk distorted thermal imagery and unreliable heat signatures. Radiometric data should never be confused with non-radiometric outputs, because only radiometric data records actual temperatures.
Emissivity settings also require calibration for each material, since incorrect values skew readings and weaken analysis. Thermal imagery should be verified with visible-light camera data to reduce false positives and confirm anomalies.
Precise execution frees the workflow from guesswork, allowing each survey to produce defensible results. When these controls are applied, thermal mapping becomes a disciplined method for locating heat loss, moisture intrusion, and other hidden conditions without unnecessary uncertainty or wasted flight time.
Frequently Asked Questions
How Often Should Thermal Cameras Be Calibrated for Accurate Readings?
Thermal cameras should typically be calibrated every 6 to 12 months, with calibration frequency increased after impacts, firmware changes, or unstable operating conditions.
Sensor alignment should be checked regularly because temperature drift and environmental factors can degrade measurement consistency.
Preventive equipment maintenance, verified calibration standards, and periodic field validation preserve thermal resolution and data reliability.
In practice, disciplined calibration supports accurate readings, operational autonomy, and technically sound decisions.
What Weather Conditions Affect Thermal Drone Mapping Accuracy Most?
Weather conditions affecting thermal drone mapping accuracy most are cloud cover, humidity levels, wind speed, temperature fluctuations, sunlight intensity, precipitation effects, atmospheric pressure, thermal inversions, and seasonal variations.
Cloud cover can stabilize contrast, while sunlight intensity and rapid temperature fluctuations distort readings. High humidity levels and precipitation effects reduce thermal transmission. Strong wind speed shifts flight paths.
Atmospheric pressure and thermal inversions alter surface cooling. Seasonal variations demand adaptive planning for precise, independent surveying.
Can Thermal Drones Detect Moisture Inside Walls or Roofs?
Yes, thermal drones can detect moisture indirectly, and the clue often appears before the problem is visible. Through thermal imaging, cooler heat signatures may indicate moisture detection during wall inspection or roof analysis.
This supports leak detection, insulation assessment, and broader building diagnostics, improving energy efficiency. Yet results remain inferential, not absolute; confirmation usually requires ground inspection.
Used properly, the method offers practical, disciplined insight and greater autonomy in maintenance decisions.
How Do Emissivity Settings Change Temperature Measurements?
Emissivity settings change measured temperature by correcting how much infrared energy a surface emits; incorrect values create temperature discrepancies.
Different surface materials require different emissivity factors, and calibration techniques help align readings with actual conditions.
Sensor types also affect measurement accuracy, while environmental influences can distort data interpretation.
Practical application scenarios include roofing, insulation, and inspections where precise settings improve reliable, liberated decision-making, especially for field operations and comparative analysis.
What File Formats Preserve Radiometric Thermal Data Best?
Radiometric TIFF and proprietary RAW typically preserve thermal image formats best; as the adage says, “measure twice, cut once.” They minimize data compression effects, retain radiometric calibration methods, and support diverse thermal sensor types.
Careful file export options, strong metadata importance, and disciplined post processing techniques reduce software compatibility issues. When paired with capable data visualization tools, these formats let users reclaim temperature truth with practical precision and analytical freedom.
Conclusion
Thermal drone mapping depends on careful camera selection, compliant flight planning, and radiometric processing to preserve temperature integrity. When overlap, altitude, and line-of-sight rules are followed, thermal datasets become reliable for inspection and analysis. RGB and infrared imagery should be captured together to improve context, while post-processing must retain calibrated values. Common errors can distort results like a warped mirror, making even small planning mistakes costly. Precision at each step determines map quality and decision value.
