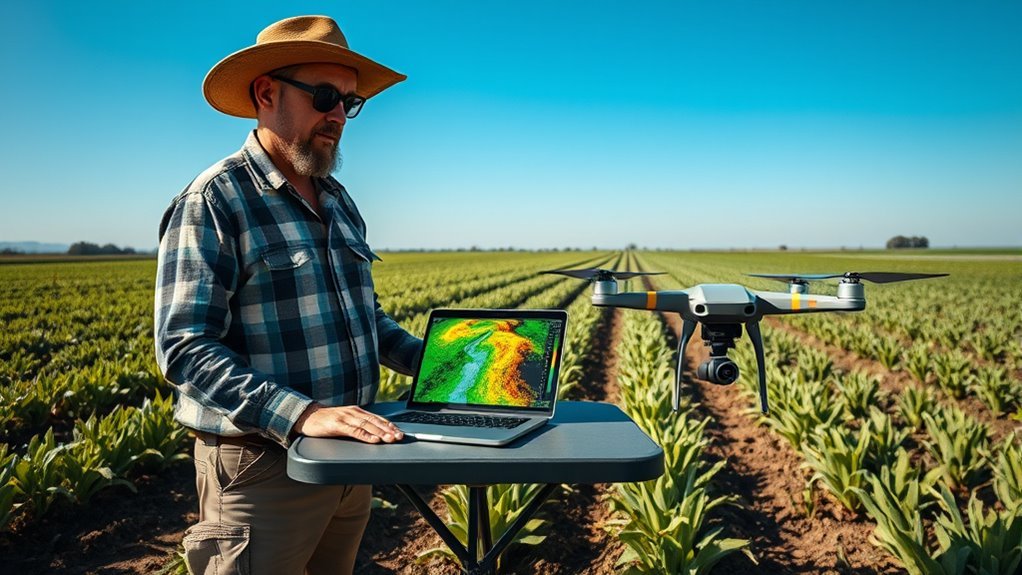
DroneDeploy NDVI testing uses drone-mounted multispectral imaging to calculate crop vigor from the NDVI formula, where values near 0.6 to 0.9 usually indicate strong plant health. The platform works best with multispectral or modified RGB sensors, consistent flight altitude, and regular capture schedules. Maps highlight stress zones for irrigation or fertilizer decisions, but ground-truthing remains essential to verify anomalies. A complete guide shows how to interpret outputs and improve field decisions with greater precision.
Key Takeaways
- DroneDeploy NDVI uses multispectral drone imagery to calculate plant health with the formula NDVI = (NIR – Red) / (NIR + Red).
- Multispectral cameras provide the most accurate NDVI results, while modified RGB and standard RGB systems offer lower-cost alternatives.
- Consistent flight altitude, proper sensor settings, and regular flight schedules are essential for reliable NDVI data collection.
- NDVI maps range from -1 to +1, with greener values indicating healthier vegetation and browner values suggesting stress.
- Ground-truthing after flights confirms anomalies caused by pests, nutrients, soil, or moisture, improving prescription accuracy.
What Is DroneDeploy NDVI?
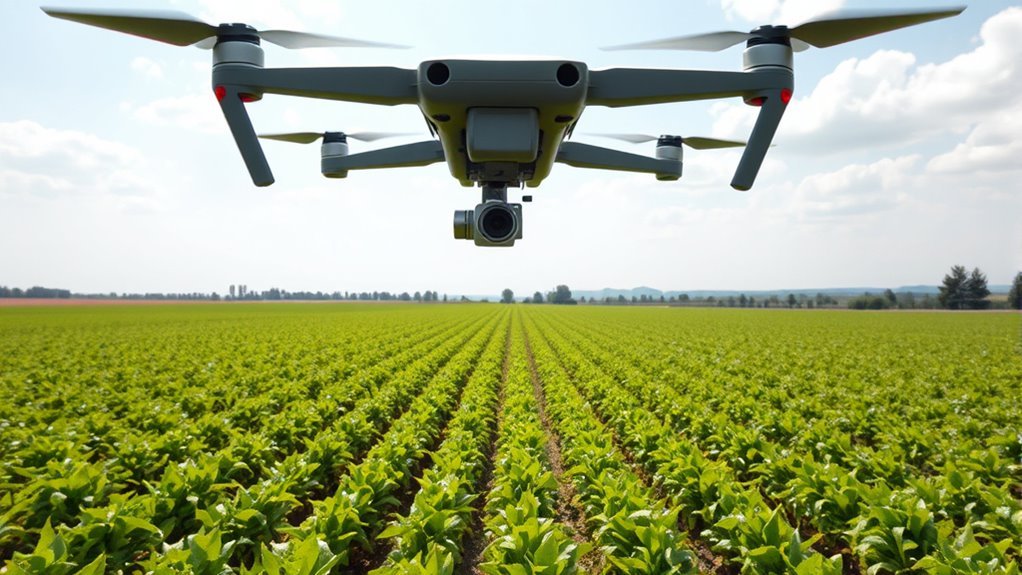
DroneDeploy NDVI is a remote-sensing workflow that uses drones equipped with multispectral cameras to capture near-infrared and red wavelengths, then converts those measurements into color-coded vegetation maps.
In this system, the NDVI formula, NDVI = (NIR – Red) / (NIR + Red), normalizes reflectance into vegetation indices ranging from -1 to +1. Values near 0.6 to 0.9 generally indicate robust plant health, while 0 to 0.2 often marks crop stress, bare soil, or weak cover.
The method supports early detection of anomalies before visible symptoms appear, enabling targeted irrigation and fertilizer decisions that reduce wasted inputs and restore agronomic autonomy.
The method enables early anomaly detection, guiding targeted irrigation and fertilizer decisions that reduce waste and restore agronomic autonomy.
Edge computing can process imagery on site, flagging zones below preset thresholds and triggering alerts without delay.
Historical NDVI records also strengthen yield forecasting and document field conditions for insurance analysis, turning data into operational leverage.
How to Choose a DroneDeploy NDVI Camera
Selecting a DroneDeploy NDVI camera begins with matching sensor capability to the intended analytical output, because not every camera can generate reliable vegetation indices.
Multispectral cameras are the strongest option for NDVI imagery, since they capture near-infrared and visible bands needed for precise plant health assessments.
Modified RGB cameras offer near-infrared capabilities and calibratable data for time-comparative analysis, but they demand a higher investment than standard RGB cameras.
RGB cameras remain the most accessible choice, yet their results are limited to relative health assessments and depend on consistent sunlight.
Decision makers should inspect camera specifications carefully, confirming that the platform supports NDVI calculations and agricultural use.
The usual investment range for modified RGB and multispectral systems is $1,200 to $7,000, so budget should align with data quality and analytical freedom.
- Multispectral cameras: highest accuracy
- Modified RGB cameras: calibrated comparison
- RGB cameras: lowest cost
How to Capture DroneDeploy NDVI Data
Once the appropriate camera has been chosen, NDVI data capture depends on disciplined flight execution and sensor settings that support reliable vegetation analysis. The drone should be equipped with a multispectral sensor capable of recording near-infrared and red light, because those bands are required to capture usable NDVI data.
Flight altitude must remain consistent to produce detailed imagery and high-resolution orthomosaic inputs. The collected images are then processed with the NDVI formula, NDVI = (NIR – Red) / (NIR + Red), to generate maps that differentiate vegetation vigor and health across the field.
Consistent flight altitude supports high-resolution imagery, while NDVI processing reveals vegetation vigor and health across the field.
Regular flight schedules help monitor change over time, revealing stress before it becomes severe. Field inspections add ground-truth validation, ensuring the output reflects actual crop conditions.
This technical workflow gives operators clearer command over plant management, supporting informed irrigation and fertilizer decisions while preserving analytical independence.
How to Read DroneDeploy NDVI Maps
NDVI maps in DroneDeploy are interpreted through a color gradient tied to vegetation vigor, with values approaching +1 typically shown in green to indicate dense, healthy plant cover, while values near 0 generally appear brown and suggest bare soil or stressed growth.
Reading NDVI requires focusing on the numeric scale from -1 to +1: 0.6 to 0.9 usually reflects strong vegetation health, while 0.2 to 0.5 indicates sparse canopy.
In practical drone mapping, the green light is not automatic approval; it is a signal to assess plant health with discipline and speed. Real-time processing supports immediate analysis, and threshold alerts can isolate zones below a chosen limit for rapid response.
Integrating soil moisture and weather layers sharpens interpretation, making NDVI maps more actionable for those seeking operational freedom.
- Green zones: high vigor
- Brown zones: stress or soil
- Alerts: immediate intervention
How to Ground-Truth DroneDeploy NDVI Results
Interpreting DroneDeploy NDVI maps is only the first step; the map output must be verified against conditions observed on the ground. Ground-truthing requires a physical inspection after each drone flight, using the camera and field notes to confirm whether NDVI values align with actual canopy status.
Healthy plants reflect more near-infrared energy, yet anomalies may also arise from soil type, pest pressure, irrigation failure, or nutrient deficiencies. By comparing data from the map with direct observations, operators can isolate the cause of variability and refine crop management decisions.
Regular inspections improve responsiveness to emerging stress before visible symptoms spread, preserving yield potential and operational autonomy. Photo documentation strengthens this process by linking locations, symptoms, and dates to historical records.
When ground-truthing is systematic, variable-rate prescriptions derived from NDVI become more accurate, and overall health assessments gain analytical credibility. This disciplined verification converts remote sensing into actionable agronomic intelligence.
Frequently Asked Questions
How Often Should NDVI Flights Be Scheduled?
NDVI flights should be scheduled weekly or biweekly, adjusted by crop growth stages and seasonal variations. NDVI flight frequency depends on ideal scheduling times, weather impact assessments, data collection intervals, aerial imaging techniques, drone maintenance tips, and flight path optimization.
Which Crops Work Best With Dronedeploy NDVI Analysis?
Crops with broad canopies and measurable vigor shifts, such as corn, soybean, wheat, and vineyard blocks, suit DroneDeploy NDVI analysis best. Crop selection depends on sensor calibration, field variability, NDVI interpretation, data validation, yield prediction, seasonal trends, imaging frequency, crop health.
Can NDVI Data Be Exported to Other Software?
Yes, it can; a stitch in time saves nine. Export supports NDVI applications, Data visualization, Software compatibility, Precision agriculture, Data integration, Image processing, Crop monitoring, GIS tools, and Analytical insights, empowering users with liberated analytical workflows.
What Weather Conditions Affect NDVI Accuracy Most?
Cloud cover, sun angle, and time of day most strongly distort NDVI accuracy; soil moisture, temperature variations, humidity levels, wind speed, precipitation effects, and seasonal changes further alter reflectance, challenging precise, liberated agronomic analysis.
How Much Does Dronedeploy NDVI Processing Cost?
DroneDeploy NDVI processing typically rides on Subscription models, with Processing fees shaped by NDVI pricing factors, Data resolution, and Seasonal variations. A Cost comparison across DroneDeploy plans, Budget considerations, and User testimonials suggests variable, case-dependent costs.
Conclusion
To summarize, DroneDeploy NDVI functions as a diagnostic lens for crop vigor, converting multispectral data into actionable spatial intelligence. When the camera is properly selected, imagery is captured consistently, and maps are interpreted with calibration in mind, the platform can reveal stress patterns with high precision. Ground-truthing remains essential, validating remote observations against field conditions. Used together, these steps turn NDVI analysis into a reliable compass for agronomic decision-making across variable growing environments.
