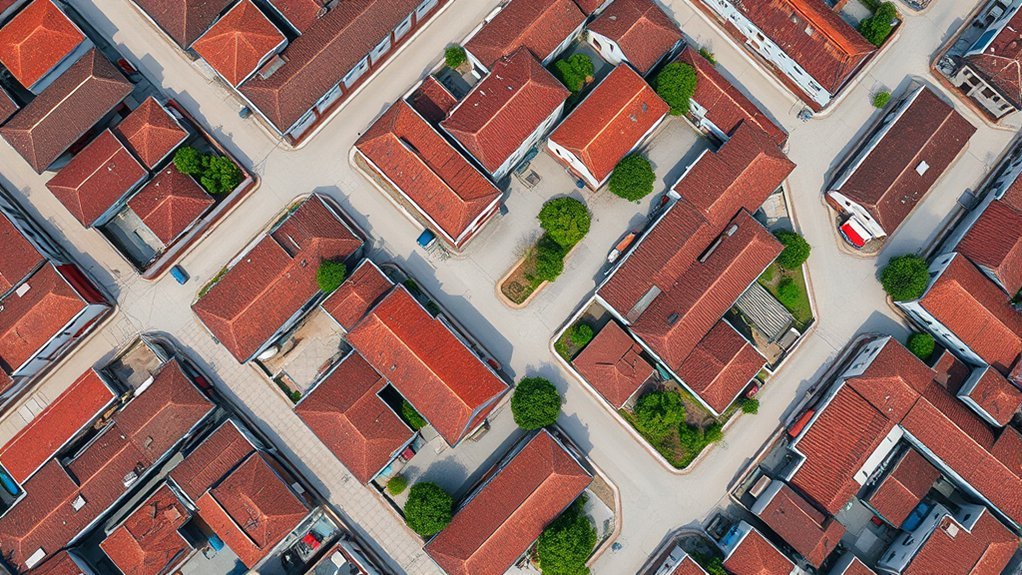
The Alexandra Orthomosaic is a high-resolution drone imagery layer covering part of Alexandra township in South Africa. Esri uses it to demonstrate land-cover classification and geospatial analysis in ArcGIS Pro. You can find the layer by searching for its exact name and owner, then combine it with other GIS data to study buildings, vegetation, roads, and urban development.
Quick Answer
Open ArcGIS Pro, choose Add Data, select ArcGIS Online under Portal, and search for Alexandra_Orthomosaic owner:Esri_Tutorials. Select the matching imagery layer to add it to your map. The dataset contains approximately 2.5-centimeter-resolution drone imagery and supports detailed land-cover analysis when used with suitable ArcGIS tools and permissions.
Last checked: September 26, 2026. Dates and figures were verified against official sources.
At a Glance
| Tools Needed | ArcGIS Pro; Image Analyst and compatible deep-learning libraries for the classification workflow. |
| Cost | Varies by software access, account privileges, hosted storage, and processing requirements. |
Accessing Alexandra Orthomosaic in ArcGIS Pro
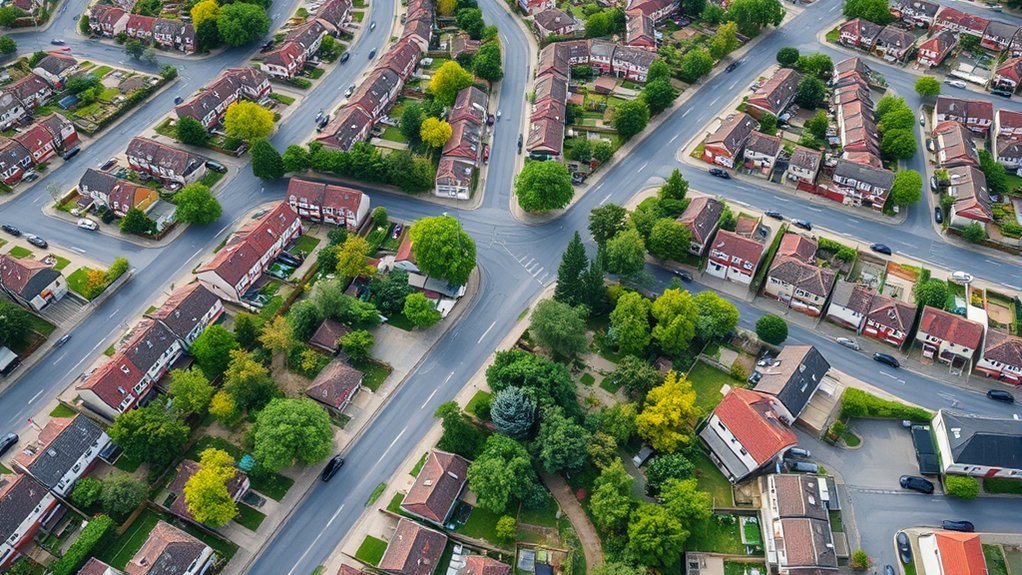
An orthomosaic is a continuous map image created by combining overlapping aerial photographs and correcting their geometry. Unlike an ordinary aerial photograph, an orthomosaic accounts for camera perspective and terrain effects, allowing mapped features to align more accurately with geographic coordinates.
The Alexandra dataset is particularly useful for studying urban land cover. According to Esri’s official land-cover tutorial, the imagery was produced from drone photographs using Site Scan for ArcGIS.
Its approximately 2.5-centimeter ground resolution allows you to inspect individual structures, streets, and vegetation patches.
The Alexandra imagery is already available as a geographic layer, so you can begin mapping without processing the original drone photographs yourself.
How to Find the Alexandra Imagery Layer
The most direct method is to search ArcGIS Online from within ArcGIS Pro. The owner filter helps distinguish the tutorial dataset from similarly named layers.
- Open ArcGIS Pro and sign in with your ArcGIS account.
- Create a new map project or open an existing project.
- On the Map tab, select Add Data.
- Under Portal, choose ArcGIS Online.
- Enter Alexandra_Orthomosaic owner:Esri_Tutorials in the search field.
- Select the matching Alexandra_Orthomosaic imagery layer.
- Click OK to add the layer to your map.
The map should display the Alexandra neighborhood. Zoom in to inspect building outlines, streets, and vegetation.
You can also search for publicly shared content through ArcGIS Online. The official ArcGIS layer documentation explains how to add imagery and other geographic layers to web maps.
If the layer does not appear, confirm the spelling, search scope, and owner name. Account permissions and the item’s sharing settings may also affect availability.
What Makes This Dataset Different?
Alexandra_Orthomosaic is a geographically corrected image layer, not a collection of ordinary photographs. Its high resolution makes it useful for identifying small surface features and examining urban land-cover patterns.
The imagery can support applications in urban planning, environmental monitoring, and infrastructure assessment. Similar orthomosaic methods are also useful in agriculture and other fields that need detailed surface maps.
However, high image resolution alone does not guarantee survey-grade positional accuracy or correct feature classification.
Tips for Integrating Orthomosaic Data Accurately
Integrating an orthomosaic requires compatible geographic coordinates, suitable resolution, and consistent layer properties. The Alexandra dataset is already processed, so you can use it directly in GIS. Ground control points become relevant when creating or correcting imagery from source photographs.
Check the Coordinate System
Before combining imagery with parcel boundaries, roads, or other datasets, inspect each layer’s spatial reference.
A geographic information system can display layers with different coordinate systems together, but that does not guarantee identical positional accuracy.
In ArcGIS Pro, open the layer properties and inspect its source information. Confirm the coordinate system, extent, and pixel size before performing measurements.
For area calculations, use a suitable projected coordinate system with appropriate measurement units.
Understand Ground Control Points
Ground control points, or GCPs, are locations with known geographic coordinates. They help connect aerial photographs to real-world positions during photogrammetric processing.
Adding well-distributed GCPs can improve absolute positional accuracy. Independent checkpoints allow you to assess the accuracy of the processed result.
Esri’s ground control documentation explains how these points support image adjustment and accuracy assessment.
You do not need to create new GCPs simply to display the existing Alexandra layer. They matter when generating a new orthomosaic or conducting a separate accuracy assessment.
Choose Appropriate File Formats and Resolution
When working with your own imagery, select an export format that preserves georeferencing and supports your intended analysis.
A georeferenced raster such as GeoTIFF is commonly suitable for desktop GIS workflows. For online sharing, hosted imagery layers provide access through web services.
Esri’s hosted imagery documentation explains the differences between tiled and dynamic imagery layers, publishing privileges, supported formats, and compression settings.
Use compression appropriate to your data. Lossy compression can reduce storage requirements but may alter pixel values.
Preserve the source imagery when precise pixel analysis or later reprocessing is required.
Manage Updates and Time-Based Comparisons
An orthomosaic represents the area when its source photographs were captured. Publishing the layer does not make it automatically reflect later physical changes.
To monitor urban development or environmental change, obtain another dated imagery dataset and align it with the earlier one.
Compare imagery captured under reasonably similar conditions. Differences in lighting, season, resolution, and processing can otherwise resemble actual land-cover changes.
Analyzing and Visualizing Orthomosaic Imagery Effectively
Orthomosaic analysis turns a detailed image into information about geographic features. In ArcGIS Pro, you can inspect the original imagery, classify surface types, and convert suitable raster results into features for measurement.
Esri’s Alexandra tutorial provides a concrete example: identifying vegetation and calculating its surface area.
Understand the Available Analysis Methods
Different tools answer different questions. The correct method depends on whether you need visual interpretation, automated classification, or measurable geographic features.
| Aspect | Description | Application |
|---|---|---|
| High Resolution | Approximately 2.5-centimeter source imagery | Inspecting buildings, streets, and vegetation |
| Machine Learning | Classifies imagery pixels into land-cover categories | Creating land-cover maps and extracting features |
| Interactive Maps | Displays imagery with other geographic layers | Communicating spatial patterns and analysis results |
The source image provides geographic context, while classified outputs make particular features easier to isolate and measure.
Classify Land Cover Using ArcGIS Pro
Esri demonstrates a pretrained deep-learning workflow using the Alexandra dataset. The model identifies land-cover categories rather than requiring you to draw every feature manually.
The tutorial uses the High Resolution Land Cover Classification – USA model from ArcGIS Living Atlas.
Although the model was developed for US imagery, Esri demonstrates its use with the Alexandra dataset in South Africa. Results still require visual review because model performance can vary between locations and feature types.
The workflow is:
- Load Alexandra_Orthomosaic into ArcGIS Pro.
- Download the pretrained land-cover classification package from ArcGIS Living Atlas.
- Open the Classify Pixels Using Deep Learning geoprocessing tool.
- Select Alexandra_Orthomosaic as the input raster.
- Choose the downloaded deep-learning package as the model definition.
- Set the processing cell size to suit the model.
- Select an available processor and run the classification.
- Inspect the resulting land-cover raster.
For the official example, Esri uses an output raster named Land_Cover_Raster.
The resulting raster contains nine land-cover categories. These include surface features such as vegetation, buildings, water, and roads.
Why Processing Resolution Matters
The Alexandra imagery has a native pixel size of approximately 0.025 meters. However, the pretrained model expects input imagery with a resolution of approximately 0.8 to 1 meter.
Esri therefore uses a processing cell size of 0.9 meters in the tutorial.
This resamples the imagery for the classification process and reduces the amount of data that must be processed.
Using the original resolution for every analytical task is not always beneficial. The model’s training resolution and intended feature size should guide the processing settings.
Calculate Vegetation Area
After classification, the raster can be converted into polygon features. This makes it possible to isolate vegetation and calculate its area.
- Open the Raster to Polygon tool.
- Select Land_Cover_Raster as the input raster.
- Use the Class field to identify land-cover categories.
- Create the polygon output layer.
- Select the Low Vegetation and Tree Canopy categories.
- Calculate the total area of the selected polygons.
- Export the selected features as a separate green-space layer.
In Esri’s worked example, the vegetation selection contains approximately 831 polygons.
The tutorial reports a combined vegetation area of approximately 403,990 square meters, or 0.404 square kilometers, for the analyzed neighborhood.
These are tutorial results, not guaranteed measurements for every processing run. Different software settings or classification results can produce slightly different values.
The same general approach can support other land-cover assessments, including changes in vegetation coverage and the distribution of developed surfaces.
Common Challenges in Orthomosaic Integration and How to Solve Them
Orthomosaic problems usually involve incorrect alignment, incomplete data, slow processing, or limitations in the source imagery. Identify whether the problem comes from the existing map layer or from processing your own photographs before making changes.
Data Alignment Issues
Misalignment occurs when geographic features in different layers do not occupy matching positions.
Common causes include incorrect coordinate systems, inaccurate georeferencing, poor image overlap, and errors in the original photogrammetric adjustment.
Start with these checks:
- Confirm that every layer has the correct spatial reference.
- Compare identifiable ground features across the datasets.
- Inspect the source imagery’s georeferencing information.
- Check whether image resolution or resampling affects the comparison.
- Review control points and checkpoints if you are processing source imagery.
When producing your own orthomosaic, consistent camera settings and adequate photograph overlap help the processing software match features between images.
Color differences between photographs may also create visible seams. Color balancing can improve visual consistency, but it does not correct geographic positioning errors.
Automated stitching reduces manual work, yet quality checks remain necessary around buildings, vegetation, and areas with limited image detail.
Processing Time Delays
Large orthomosaic datasets require substantial memory, storage, and processing capacity. High-resolution imagery can slow both desktop analysis and online transfer.
The Alexandra tutorial provides a practical solution for deep-learning processing: use a cell size that matches the model rather than processing every native-resolution pixel.
It also recommends an NVIDIA GPU with at least 4 GB of dedicated memory for its example workflow.
If memory errors occur, reduce the batch_size setting from 4 to 2 or 1. A CPU may also be used, although processing can take considerably longer.
Other useful approaches include:
- Test the workflow on a smaller geographic extent before processing the full image.
- Use appropriate raster pyramids or optimized storage formats where supported.
- Reduce unnecessary background processing.
- Check available disk space and memory.
- Use suitable cloud processing resources when local hardware is insufficient.
For newly collected drone imagery, efficient flight planning and sufficient overlap can also reduce problems during the original orthomosaic generation.
When the Classification Looks Incorrect
An automated model may confuse visually similar surfaces. Roofs, roads, bare ground, and some informal structures can be difficult to distinguish.
Esri specifically notes that its Alexandra example performs better for vegetation than for certain building types.
Before accepting the output, compare classified features against the original imagery. Inspect representative areas and consider a different model or extraction method when the results do not match visible features.
Tools for Visualizing Orthomosaic Imagery
ArcGIS provides tools for displaying orthomosaics alongside roads, buildings, demographic information, and analytical results. Effective visualization should make geographic relationships clear without hiding important image details.
Visualization Techniques Overview
ArcGIS Pro supports raster display, transparency adjustments, feature symbology, and map layouts. ArcGIS Online Map Viewer provides additional options for interactive maps.
The official imagery styling documentation describes supported options such as RGB display, stretch, classification, and color maps.
Available styling choices depend on the imagery layer’s underlying data and capabilities.
Useful techniques include:
- Transparency: Reveal the basemap or other geographic layers beneath the imagery.
- Layer blending: Compare overlapping visual information.
- Color classification: Highlight different land-cover categories.
- Feature symbology: Use distinct colors for buildings, vegetation, or other extracted features.
- Interactive maps: Allow users to explore the study area and inspect relevant layers.
ArcGIS dashboards and infographics can present analytical findings to stakeholders without requiring them to work directly with the source raster.
Three-dimensional visualization is also possible when suitable elevation or 3D data is available. However, an RGB orthomosaic alone does not provide subsurface information or a complete 3D terrain model.
Tools for Data Analysis
Orthomosaic imagery becomes more useful when combined with tools that measure geographic patterns and connect them to other information.
Key capabilities include:
- Spatial Analysis: Examine relationships between geographic features and compare mapped conditions.
- Data Visualization: Create interactive maps that communicate land-cover patterns.
- Demographic Integration: Combine mapped features with relevant population and land-use information.
- Geospatial AI: Use suitable machine-learning models to classify pixels or extract features.
For example, a green-space layer derived from Alexandra imagery can be compared with other geographic datasets to examine where vegetation occurs relative to developed areas.
RGB imagery can help identify visible vegetation, but it does not provide the additional spectral measurements required for standard multispectral vegetation indices such as NDVI.
Analysis results should reflect the imagery’s acquisition period, resolution, and known limitations.
Using ArcGIS Services: A Step-by-Step Guide
ArcGIS services allow you to display and share geographic information without placing every source file inside a local project. The correct workflow depends on whether you are viewing an existing service, publishing your own imagery, or building an application.
Display Imagery in ArcGIS Online
Map Viewer provides a straightforward way to combine imagery with other geographic layers.
- Open ArcGIS Online and sign in when required.
- Open Map Viewer.
- Search for the imagery layer.
- Add it to the map.
- Choose an appropriate basemap.
- Add the other geographic layers needed for your analysis.
- Adjust visibility, transparency, and supported styling options.
- Save the web map if your account has the required privileges.
Hosted feature layers can add geographic context, while imagery layers display raster information.
When publishing your own raster data, select a service type that supports your intended use. A simple raster tile layer is suitable for visualization, while hosted imagery layers offer additional raster-analysis capabilities.
Use the ArcGIS REST API for Custom Applications
Developers can connect applications to supported ArcGIS services through the REST API.
Image services can expose metadata and operations for displaying imagery, retrieving pixel information, and performing supported raster tasks.
Esri’s Image Service REST API documentation explains these capabilities.
However, ordinary ArcGIS Pro and Map Viewer users do not need to make manual REST requests just to display the Alexandra dataset.
Custom applications should use the correct service endpoint and respect the layer’s permissions and supported operations.
Understand Costs and Account Permissions
Viewing publicly shared imagery is different from publishing, storing, or processing your own datasets.
ArcGIS Online uses credits for certain transactions, including hosted imagery storage and supported analysis operations.
The exact credit requirement depends on the operation and the amount of data involved. Esri’s ArcGIS credits documentation explains these charges.
Software licensing and extension requirements are separate considerations.
The official Alexandra classification workflow requires ArcGIS Pro, ArcGIS Image Analyst, and compatible deep-learning libraries.
Publishing a new hosted imagery layer also requires the appropriate ArcGIS Online privileges.
Check Usage Rights Before Sharing Imagery
Access to a publicly shared map does not automatically establish unrestricted reuse rights.
ArcGIS item pages can include ownership information, acknowledgments, licensing conditions, and other usage restrictions.
Review these details before downloading, republishing, distributing, or commercially reusing imagery.
Esri’s item usage-rights documentation explains how content owners specify restrictions and attribution requirements.
When sharing a derived map, retain the required source acknowledgments and comply with the applicable terms.
Frequently Asked Questions
What Are the System Requirements for Using the Orthomosaic Imagery?
Requirements depend on the task. Viewing the layer requires a compatible GIS application and appropriate access. Esri’s classification workflow uses ArcGIS Pro, Image Analyst, and compatible deep-learning libraries. The tutorial recommends an NVIDIA GPU with at least 4 GB of dedicated memory, although CPU processing is possible.
Can I Customize the Orthomosaic Imagery Styles?
Yes. Supported imagery layers can use display settings such as transparency, color adjustment, and appropriate raster styling. You can also style derived polygon layers by land-cover category. Available options depend on the layer type and its underlying data.
Is There a Cost Associated With Accessing the Data?
Costs depend on how you access and process the imagery. Public viewing may not require payment, but ArcGIS Pro licensing, hosted imagery storage, and some analysis operations can involve charges or credits. Access to the Alexandra layer does not establish unrestricted downloading or republishing rights.
How Often Is the Orthomosaic Imagery Updated?
The Alexandra dataset has no confirmed recurring update schedule in the referenced tutorial. An orthomosaic represents the conditions captured during its source survey. Monitoring later changes requires imagery from another acquisition period and a consistent comparison method.
Are There Any Licensing Restrictions for Using the Imagery?
Usage restrictions depend on the content owner’s terms. Review the item’s usage conditions and acknowledgments before downloading, publishing, or commercially reusing the imagery. Public access does not necessarily remove attribution requirements or other restrictions.
Can I Download the Original Alexandra Orthomosaic?
Downloading depends on the item’s available options and permissions. A layer that can be displayed in ArcGIS is not necessarily offered as a downloadable source raster. Inspect the item details to determine whether downloading or exporting is supported.
Can an Orthomosaic Be Used for 3D Analysis?
Yes, when suitable elevation or three-dimensional data is available. An orthomosaic supplies geographically corrected surface imagery, but it does not independently describe terrain height or underground structures. Combine it with appropriate elevation models or 3D datasets for those applications.
Conclusion
The Alexandra Orthomosaic provides detailed geographic imagery for studying urban land cover in ArcGIS. Its greatest value comes from combining the original image with suitable classification tools, accurate geographic references, and carefully reviewed analytical results.
Start by loading the official imagery layer into ArcGIS Pro. Then inspect its properties, test the analysis workflow on a manageable area, and validate the output before using it for mapping or decision-making.
Sources
- Esri Learn ArcGIS: Extract High-Resolution Land Cover with Geospatial AI: Dataset specifications, software requirements, classification settings, and vegetation measurements.
- ArcGIS Online: Add Layers to Maps: Adding geographic layers to web maps.
- ArcGIS Pro: Ground Control Points: Ground control, image adjustment, and independent accuracy assessment.
- ArcGIS Online: Publish Hosted Imagery Layers: Raster publishing, layer types, supported formats, and permissions.
- ArcGIS Online: Style Imagery in Map Viewer: Imagery visualization and styling options.
- Esri Developer: Image Service REST API: Image service resources and supported operations.
- ArcGIS Online: Understand Credits: Credits associated with storage and processing.
- ArcGIS Online: Terms of Use for Items: Licensing, attribution, and content usage conditions.
