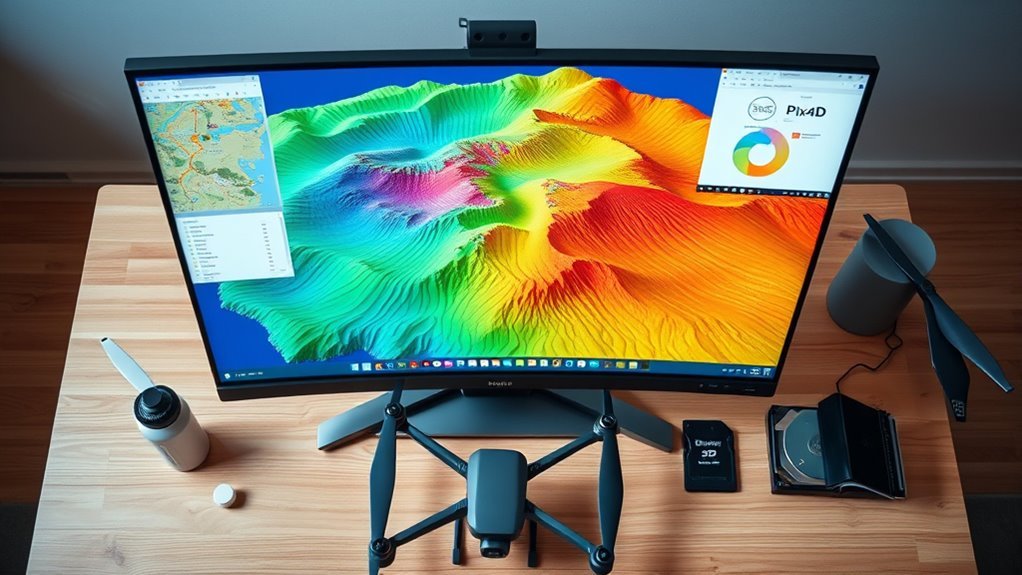
Drone surveys can be converted into contour lines, but the result depends on how the imagery is processed and which interval is selected. WebODM, QGIS, and Pix4D each produce contours from a DSM or DEM, yet each handles export, smoothing, and elevation precision differently. Small errors in surface generation can distort linework. The next step is determining which workflow gives the most usable output for mapping, design, and deliverables.
How to Turn Drone Imagery Into a DEM

To generate a Digital Elevation Model (DEM) from drone imagery, high-resolution aerial photographs should be captured with a suitable drone camera at a consistent flight altitude to maintain uniform image overlap.
In Drone Mapping, this acquisition strategy reduces geometric distortion and improves surface reconstruction fidelity. The image set is then processed in photogrammetry software such as Pix4D, WebODM, or QGIS, where frames are aligned, common tie points are identified, and a dense 3D point cloud is produced.
Ground control points can be integrated to strengthen positional accuracy and support measurement integrity. Next, the point cloud is classified into ground and non-ground returns, then interpolated into a Digital Elevation Model (DEM) representing terrain elevation across the survey area.
Within QGIS, the Raster tools can convert the classified surface into a raster DEM suitable for GIS workflows. Saving the output as GeoTIFF preserves compatibility for analysis, mapping, and planning that support data autonomy and spatial decision-making.
Choose the Right Contour Interval
The contour interval defines the vertical difference between adjacent contour lines and directly controls how terrain variability is represented on the map.
On an elevation raster, the selected contour interval determines whether subtle grade changes are exposed or smoothed into broader trends. Standard values usually fall between 1 and 10 feet, with 2 feet commonly used for detailed engineering and construction work.
A 1-foot interval increases resolution in steep or complex terrain and supports precise grading plans, while 5- to 10-foot intervals are more efficient for flatter landscapes and general land use planning.
The appropriate setting depends on map scale, vertical relief, and the analytical objective. Smaller intervals produce more contour lines and higher visual density; larger intervals reduce clutter and improve readability.
In QGIS and Pix4D, the contour interval can be configured during generation so the output remains technically rigorous, legible, and fit for independent spatial analysis.
Create Contours in WebODM
In WebODM, contour generation begins with a processed drone dataset used to create a DSM, which provides the elevation surface for line extraction.
The Contours plugin then applies the selected contour interval and related settings, including line style parameters such as color and thickness, to produce the final map output.
The resulting contours can be exported as GeoTIFF or shapefile for direct use in GIS software.
WebODM Export Steps
- Confirm the project contains a completed DSM or DTM from drone imagery.
- Open Export and choose Contours to start generation.
- Set the contour interval during export to match survey requirements.
- Exported contours arrive in GeoJSON, ready for QGIS or other GIS tools.
After export, WebODM users can overlay the contours on the DSM or DTM to validate completeness, spatial accuracy, and elevation consistency.
This supports open geospatial analysis and practical field autonomy.
Contour Settings Explained
Contour settings in WebODM define how DSM-derived elevation data is translated into usable linework, with contour interval as the primary control over vertical spacing between lines. The interval determines the granularity of contour lines, enabling either coarse terrain summaries or dense, high-detail mapping.
WebODM generates contours directly from Digital Surface Models (DSMs) created during orthomosaic processing, so source resolution materially affects positional accuracy. Higher-resolution DSMs typically produce more faithful elevation representation and sharper breakline behavior.
Styling controls support thickness adjustment and elevation-based color coding, improving interpretation without obscuring structure.
Export options in multiple GIS-compatible formats allow contours to move freely into downstream analysis, preserving access to terrain data and supporting workflows that favor precision, interoperability, and spatial autonomy.
Create Contours in QGIS
In QGIS, contour generation begins with loading a DEM or DSM raster containing elevation values from drone-derived data.
The Raster menu’s Contour tool is then applied to the selected raster, with the contour interval set to define line spacing.
Output is written as a vector layer, enabling subsequent analysis and cartographic styling.
Load Elevation Raster
To generate contour lines in QGIS, the elevation raster is first loaded through Layer > Add Layer > Add Raster Layer, typically using a GeoTIFF (.tif) derived from drone processing workflows such as a DSM or DTM.
This Drone Mapping output carries each Elevation value as surface data for analysis. Properly defined Coordinate Systems are essential, because unresolved CRS metadata can distort spatial relationships and reduce contour accuracy.
- Select the raster with verified georeferencing
- Confirm DSM or DTM suitability
- Check CRS before analysis
- Preserve the file for reproducible workflows
Loaded correctly, the dataset becomes a controlled surface model, ready for contour derivation and downstream spatial interpretation.
Run Contour Tool
The Contour tool in QGIS is accessed through the Processing Toolbox under the Raster menu and is used to derive contour lines from a DEM or DSM.
In Drone Mapping workflows, the user selects the input raster, defines a contour interval such as 1 ft for construction-grade analysis, and specifies an output format for storage and exchange.
The Contour tool converts elevation data into discrete line features, enabling measurement, classification, and spatial comparison. Optional smoothing reduces visual noise and improves geometric fidelity.
Output contours may be symbolized by elevation to support engineering plans, environmental reports, and stakeholder review.
The resulting layer can be exported to other GIS platforms or used for downstream analysis, giving project teams precise terrain intelligence and broader operational autonomy.
Create Contours in Pix4D
Pix4D generates contour lines from a processed Digital Surface Model (DSM), using the elevation values derived from drone imagery as the base surface.
In Drone Mapping workflows, the operator opens the Products tab and selects Generate Contours after DSM processing completes. The contour interval is defined there, allowing precise elevation banding for topographic analysis and field planning.
Accurate georeferencing remains critical, because positional fidelity determines how faithfully the contours represent terrain. When alignment is sound, the resulting vectors support disciplined mapping and transparent decision-making.
- Select the DSM as the elevation source.
- Specify the contour interval before generation.
- Export contours as shapefiles or DXF.
- Check Pix4D updates for improved processing efficiency.
The output can then be integrated into GIS platforms for further measurement, design, or reporting, without dependence on proprietary display layers.
Fix Common DEM and Contour Problems
Common DEM and contour failures usually trace back to classification, datum, or resolution issues in the elevation model. In Drone Mapping workflows, the Digital Elevation Model (DEM) must classify ground returns correctly; poor filtering can inject centimeter-level errors that distort contour generation.
Datum alignment should be verified before processing, because a coordinate system mismatch can shift elevations by 30 to 100+ cm in dense vegetation. For construction, a 1-foot contour interval is the minimum practical standard, preserving usable detail without obscuring grade changes.
Resolution also matters: DEMs sampled at 1.5 to 5 cm per pixel usually produce sharper, more defensible contours in complex terrain. Automated tools such as QGIS Contour or ArcGIS Pro 3D Analyst reduce manual mistakes and improve repeatability.
When these variables are controlled, contour lines reflect the surface rather than the artifacts imposed on it.
Export Contours for Clients and Plans
Exporting contour lines for clients and plans requires matching the output format to the delivery workflow and the software used to generate the data.
In Drone Mapping, deliverable Contours should preserve elevation integrity, scale, and attribution so engineers can use them without rework. WebODM exports contours from a DSM after selecting the Contours option and interval, while QGIS produces them from DSM or DTM inputs through the Contour tool.
Pix4D can generate contours through Export settings tied to processed orthomosaics or DSMs. For plans, labels should display elevation values clearly, and files should be delivered in GeoTIFF or Shapefile formats for broad GIS compatibility. This supports transparent site grading, faster approvals, and Volume calculations that remain auditable.
- Set contour intervals to match project tolerances
- Verify labels before release to clients
- Use Shapefile or GeoTIFF for portability
- Align export settings with plan scale
Frequently Asked Questions
Is Pix4d Better Than Dronedeploy?
Pix4D is often better for advanced photogrammetry needs, while DroneDeploy excels in simplicity and speed.
In a Pix4D features comparison, it offers broader georeferencing options, richer exports, and stronger analytical control.
DroneDeploy user experience is more intuitive for rapid field workflows.
Photogrammetry software pricing favors DroneDeploy for many smaller teams, since Pix4D usually costs more.
The choice depends on whether precision and autonomy outweigh convenience and lower entry cost.
How Do I Create Contour Lines From a Raster in QGIS?
In QGIS, contour line generation begins by loading the raster, confirming an elevation-friendly CRS, then opening Raster > Extraction > Contour.
The operator sets the interval, attributes, and output vector path; one size fits all rarely applies, so interval selection should match terrain variance.
These raster analysis techniques produce elevation data visualization as editable lines.
Accuracy should be validated against GCPs or reference DEMs before downstream mapping or engineering use.
What Is the Best Photogrammetry Software for Drones?
Pix4D is often the strongest photogrammetry software for drones when data accuracy is the priority, though Metashape and DroneDeploy serve different workflows.
A technical Software Comparison shows Pix4D excels in DSM, DTM, and dense reconstruction, while WebODM offers a liberated open-source path for Drone Mapping Techniques.
Choice depends on budget, processing scale, and required precision.
For surveying and contour-ready outputs, high Data Accuracy typically favors Pix4D or Metashape.
Can Pix4d Process Lidar Data?
Pix4D does not natively process LiDAR data; it is a photogrammetry engine, not a LiDAR analyzer.
Like a key fitted to the wrong lock, it handles imagery well but leaves point-cloud classification to specialized tools.
For LiDAR data processing, LAStools or Global Mapper are preferred before import.
Pix4D features can then use DSMs or DTMs, preserving Drone mapping advantages while enabling precise, liberated terrain analysis.
Conclusion
To summarize, generating contour lines from drone data depends on a clean DEM, an appropriate contour interval, and software-specific export settings. WebODM, QGIS, and Pix4D each provide reliable workflows, but output quality is only as strong as the underlying surface model. When elevation artifacts are corrected and contours are validated, the results become fit for mapping, grading, and design. With the right processing, the data can be made to sing across engineering and GIS applications.
