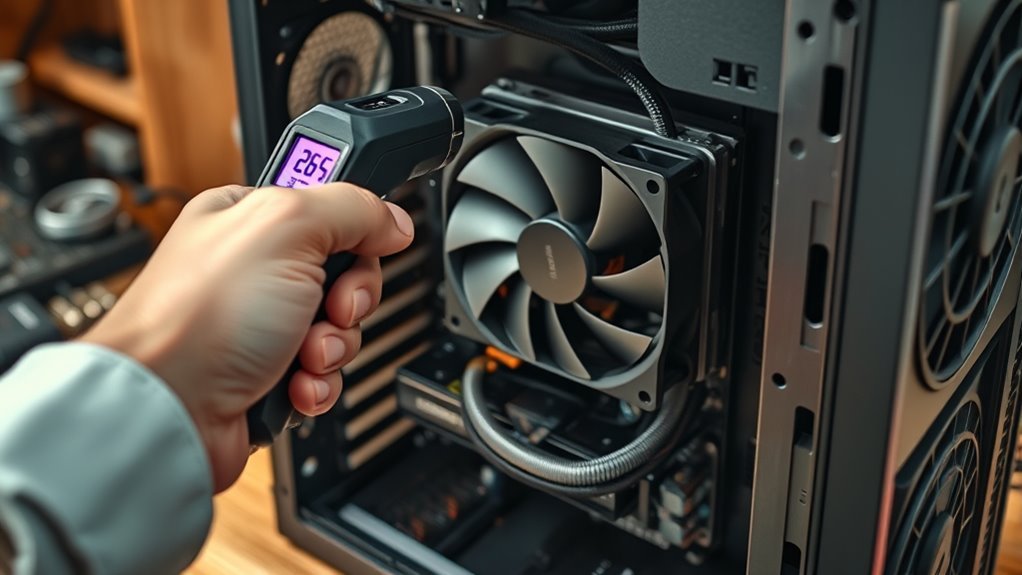
A GPU repaste stress test is the best way to check whether fresh thermal paste has improved cooling. Idle temperatures alone cannot confirm good contact between the graphics chip and its heatsink. You need to monitor the card under sustained load, compare temperatures with its specifications, and check for throttling or instability.
Quick Answer
After repasting your GPU, run a controlled 15–30 minute stress test using Heaven, FurMark, or AIDA64 while monitoring temperatures with HWiNFO or MSI Afterburner. A successful repaste produces stable temperatures below your GPU’s specified thermal limits, without unexpected throttling, crashes, or visual artifacts. Compare results with your previous readings whenever possible.
At a Glance
| Time Required | 15–30 minutes of sustained testing, plus preparation |
| Tools Needed | HWiNFO or MSI Afterburner; Heaven, FurMark, or AIDA64 |
What GPU Temperature Is Normal After Repasting?
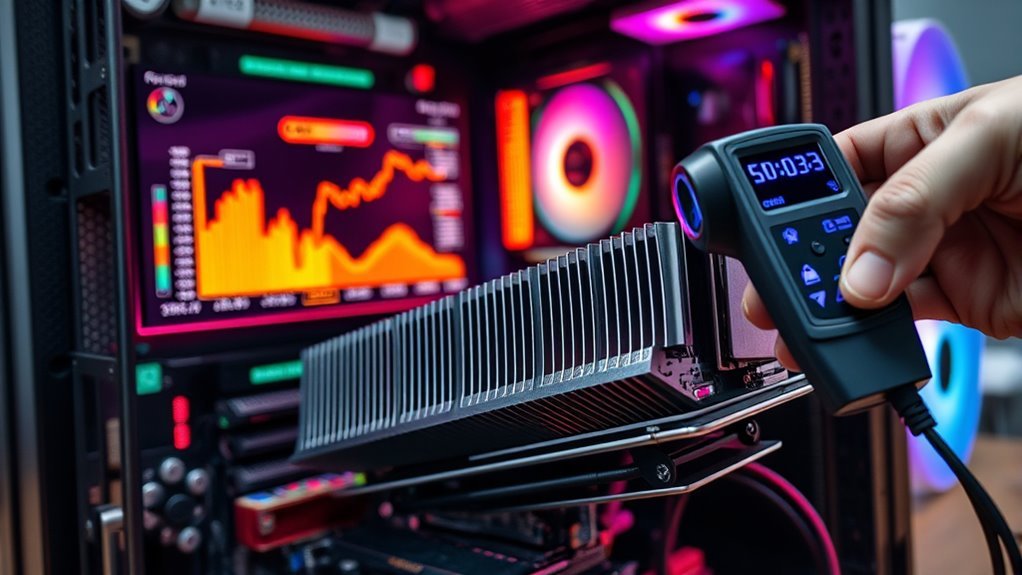
A GPU temperature of 75–80°C under load can be normal after repasting, but it is not a universal target. Acceptable temperatures depend on the GPU model, cooler, power consumption, fan settings, and room temperature.
The most reliable reference is your graphics card’s published thermal specification. For example, NVIDIA lists a maximum GPU temperature of 88°C for the GeForce RTX 5080.
That specification is more meaningful for an RTX 5080 than a general recommendation to keep every GPU below 90–95°C.
A successful repaste should improve thermal contact and keep the GPU stable within its model-specific operating limits.
Understand Core, Hotspot, and Memory Temperatures
Monitoring the correct sensor is essential because a graphics card can report several different temperatures.
| Reading | What It Measures | Why It Matters |
|---|---|---|
| GPU core temperature | The main reported GPU temperature | Shows overall chip cooling behavior. |
| GPU hotspot or junction | The hottest reported area of the GPU die | Can reveal uneven contact or localized heating. |
| Memory temperature | Temperature of supported video memory sensors | Helps identify memory cooling problems. |
Not every GPU exposes every sensor. AMD’s performance monitoring documentation distinguishes GPU current temperature from junction temperature.
Hotspot readings are normally higher than the main GPU temperature. Compare each reading with the appropriate specification rather than applying the core temperature limit to every sensor.
Also consider the difference between core and hotspot readings. An unusually large difference compared with the card’s previous behavior can suggest uneven heatsink contact.
What About Idle Temperatures?
Idle temperatures below 60–65°C may be acceptable, but this range is not proof of a successful paste job.
Some graphics cards stop their fans during light workloads. Others keep memory clocks elevated when driving multiple monitors or high-refresh-rate displays.
Room temperature and case airflow also affect idle readings. A warm idle temperature becomes more concerning when it is accompanied by abnormal load temperatures or fan behavior.
How to Stress Test a Repasted GPU?
Start with a moderate graphics workload, then move to a sustained test while monitoring the card. A 15–30 minute session is a practical initial check, provided the GPU remains within its specified thermal limits.
Use the same workload and settings when comparing results from before and after repasting.
Warning: Do not continue a stress test if the GPU exceeds its specified thermal limit, develops severe visual artifacts, repeatedly crashes, or shows abnormal fan behavior. Stop the workload and investigate the cooling system before testing again.
- Check the installation. Confirm that the cooler is securely mounted, its fan cables are connected, and no cables obstruct the fans.
- Restore normal settings. Use stock GPU clocks, power limits, and fan behavior for the initial test. Disable unstable manual overclocks.
- Open HWiNFO or MSI Afterburner. Identify the GPU core, hotspot, memory temperature, fan speed, and clock readings available on your card.
- Record idle readings. Let the system settle before starting the workload.
- Start a graphics test. Use Heaven or another familiar GPU benchmark for the first run.
- Watch the temperature curve. Observe whether temperatures rise and then stabilize rather than continuing toward the card’s thermal limit.
- Continue sustained testing. If the initial run is normal, complete a 15–30 minute session while watching for throttling, artifacts, or instability.
- Record the results. Note the peak temperatures, fan speed, clock behavior, and workload settings.
- Test a real application. Run a demanding game or rendering task to confirm that the card behaves normally outside the benchmark.
A GPU can pass a short benchmark yet still experience problems during specific games or longer rendering workloads. The final real-world test helps catch those issues.
Stress Test Tools
FurMark, Heaven Benchmark, and AIDA64 can all help evaluate a repasted GPU. However, they generate different workloads and should not be treated as interchangeable temperature tests.
FurMark creates a particularly demanding graphics workload. It is useful for exposing cooling weaknesses, but it can produce more heat and power demand than ordinary gaming.
UNIGINE Heaven Benchmark provides a graphics-intensive rendering workload that can be repeated for stability testing. It is useful when comparing performance and temperatures under consistent settings.
AIDA64 provides another option for controlled hardware stress testing. Select the GPU workload rather than unnecessarily combining multiple system stress tests during the initial cooling check.
OCCT can also help investigate GPU stability and memory-related problems when a temperature test reveals symptoms that need further diagnosis.
Monitor GPU Temps
During testing, temperature alone does not tell the complete story. Track fan speed, GPU utilization, clock frequency, and power consumption alongside the available thermal sensors.
The temperature will normally rise quickly at first and then approach a stable operating level as the cooler removes heat.
Small fluctuations are expected when power draw or fan speed changes. However, continuously rising temperatures, unexpected clock reductions, and repeated fan surges deserve attention.
Compare results under similar conditions. A test in a warm room with restricted airflow will not provide a fair comparison with an earlier test performed in a cooler environment.
For reliable before-and-after measurements, use the same benchmark settings, power profile, fan configuration, and case arrangement.
Which Tools Should You Use to Monitor GPU Temps?
HWiNFO is useful for detailed sensor readings and logging, while MSI Afterburner makes it convenient to watch temperatures and performance during games.
AIDA64 can also display thermal behavior during its stability tests. Choose the tool that exposes the sensors needed for your particular GPU.
HWiNFO Monitoring
HWiNFO provides detailed hardware monitoring and reporting. Its Sensors-Only mode is useful for checking a repasted GPU without opening unrelated system information.
Look for these readings where your hardware supports them:
- GPU core temperature
- GPU hotspot or junction temperature
- GPU memory temperature
- GPU fan speed
- GPU power consumption
- GPU core clock and utilization
Use the current, minimum, maximum, and average values to understand how the card behaves throughout the test.
Sensor logging is especially useful because it records temperature changes while you play or run a benchmark.
Reset the recorded minimum and maximum values before testing. Otherwise, an earlier reading could be mistaken for a temperature reached during the current session.
GPU Stress Tests
AIDA64 combines stress testing with temperature, fan, voltage, and power monitoring. Its System Stability Test documentation explains how individual workloads can be selected and monitored.
MSI Afterburner offers live monitoring during benchmarks and games. Its hardware monitoring guide also explains temperature graphs, fan behavior, and on-screen readings.
Use HWiNFO for detailed records and Afterburner when you prefer an in-game overlay.
If a particular temperature sensor is unavailable, do not assume the GPU lacks that thermal measurement internally. Monitoring support varies by graphics card, driver, and software.
How to Tell If the Paste Job Worked?
A successful GPU repaste should produce stable cooling behavior under load, with temperatures remaining within the card’s specifications.
The strongest evidence is an improvement over the previous readings when the workload, fan speed, power consumption, and ambient conditions are comparable.
For example, if a GPU previously reached unusually high temperatures under a particular benchmark, repeat that test after repasting.
Look for these signs:
- Lower temperatures: Core or hotspot readings improve under comparable conditions.
- Stable temperature curve: Heat levels settle instead of rising continuously.
- Consistent performance: Clock speeds do not fall unexpectedly because of thermal limits.
- Normal fan behavior: The cooler no longer needs unusually aggressive fan speeds for the same workload.
- No instability: Games and benchmarks run without thermal-related crashes, freezes, or artifacts.
If you lack pre-repaste measurements, compare your results with the card’s specifications and normal behavior for the same model.
A cooler GPU is not automatically faster. Modern graphics cards adjust clock speed and power according to available thermal headroom.
Therefore, a successful repaste may appear as lower temperatures, quieter fans, steadier clocks, or a combination of these improvements.
What Signs Point to a Bad GPU Paste Job?
A poor GPU paste job often causes abnormal hotspot temperatures, rapid thermal throttling, or worse cooling than before the repair.
However, these symptoms can also result from poor airflow, failed fans, incorrect thermal pads, or mounting problems. Do not assume the paste itself is responsible without checking the surrounding hardware.
| Symptom | Possible Cause | What to Check |
|---|---|---|
| High core temperature | Poor heatsink contact or inadequate cooling | Mounting pressure, paste coverage, and airflow |
| Unusually high hotspot temperature | Uneven contact or localized heating | Heatsink seating and contact across the die |
| High memory temperature | Poor memory cooling contact | Thermal pad placement and thickness |
| Repeated fan surges | Temperature fluctuations or aggressive fan settings | Temperature graph, fan curve, and workload |
| Crashes or visual artifacts | Heat, unstable clocks, memory problems, or power issues | Thermal readings and system stability |
Unexpected temperature spikes can suggest inconsistent contact, but they do not prove that air bubbles formed beneath the heatsink.
Likewise, excess paste around the GPU die does not automatically mean the repair has failed. The risk depends on the compound and whether it contacts sensitive components.
Check Thermal Pads Before Repasting Again
Thermal pads deserve particular attention if temperatures worsened immediately after reassembly.
Graphics cards commonly use pads or thermal putty between memory chips, power components, and the heatsink. These materials are not interchangeable with ordinary GPU core paste.
If replacement pads are too thick, they can prevent the cooler from sitting correctly against the GPU die.
If they are too thin or incorrectly positioned, memory or power components may lose proper thermal contact.
The iFixit thermal pad replacement guide illustrates the importance of correct component coverage and even heatsink mounting.
Warning: Disconnect power before opening a graphics card. Follow the exact model’s repair instructions, preserve the original thermal pad layout, and use the specified replacement thickness. Incorrect pads or mounting pressure can damage components or worsen cooling.
When Should You Reapply GPU Thermal Paste?
Reapply GPU thermal paste when testing shows that thermal contact is likely inadequate, not simply because a fixed amount of time has passed.
Paste replacement may be justified when sustained temperatures have increased significantly, the GPU throttles under normal workloads, or inspection reveals poor paste coverage.
There is no universal replacement interval for every graphics card.
Actual service life depends on the compound, operating temperatures, mounting design, and workload. A card with stable cooling does not automatically need repasting after one or two years.
Before reopening the GPU, follow this troubleshooting order:
- Confirm that temperature readings are from the correct sensors.
- Check GPU utilization, power consumption, and fan operation.
- Inspect the case and heatsink for airflow restrictions or dust buildup.
- Restore normal GPU settings if an overclock or custom fan curve is active.
- Compare temperatures using a consistent workload.
- If overheating persists after a recent repair, inspect mounting pressure, paste coverage, and thermal pad placement.
If you are uncomfortable disassembling the card, have a qualified repair technician inspect it.
Repeatedly removing the heatsink without identifying the underlying problem can introduce new mounting or thermal pad issues.
Key Takeaways
- GPU core, hotspot, and memory temperatures are different readings with different thermal considerations.
- Before-and-after comparisons are most useful when workload, fan speed, power settings, and ambient temperature are similar.
- Poor thermal pad contact can cause overheating even when the GPU core paste is correctly applied.
- Stable clocks and normal fan behavior are useful evidence alongside temperature readings.
- Thermal paste should be replaced based on cooling performance and physical condition, not a universal calendar schedule.
Frequently Asked Questions
How to Test if You Need New Thermal Paste?
Monitor GPU core and hotspot temperatures during a repeatable workload. Compare them with earlier readings and the card’s specifications. If temperatures have increased, throttling occurs, and airflow or fan problems have been ruled out, the thermal paste or heatsink contact may need attention.
Is 90°C Bad for a CPU?
A CPU temperature of 90°C is not automatically unsafe. Acceptable temperatures depend on the processor’s specified thermal limit and operating conditions. Some modern CPUs can approach their limits during demanding workloads. Check for excessive throttling, instability, or cooling problems rather than judging the processor by one reading.
How Do I Know if My Thermal Paste Is Applied Correctly?
Correct application is indicated by stable temperatures, good heatsink contact, and normal performance under load. Compare results before and after repasting when possible. Uneven paste coverage, poor mounting pressure, or misplaced thermal pads can prevent proper heat transfer even when the compound itself is suitable.
Is 120°F Hot for a CPU?
No. A CPU temperature of 120°F, approximately 49°C, is generally not concerning. It is well below the thermal limits of many modern processors. However, normal temperatures depend on workload and cooling design. Compare readings with the processor’s specifications and monitor behavior during sustained use.
Conclusion
A GPU repaste stress test should confirm stable temperatures, normal fan behavior, and consistent performance under sustained load.
Use HWiNFO or MSI Afterburner to monitor the card, then compare the results with its specifications and previous readings. If temperatures remain abnormal, investigate airflow, heatsink contact, and thermal pads before applying paste again.
Sources
- NVIDIA GeForce RTX 5080 specifications: Published maximum GPU temperature and model-specific thermal specifications.
- AMD performance metrics documentation: GPU temperature, junction temperature, and hardware monitoring metrics.
- HWiNFO: Hardware sensor monitoring and logging capabilities.
- UNIGINE Heaven Benchmark: Graphics benchmarking and stability testing.
- AIDA64 System Stability Test: Workload selection, temperature monitoring, and stability testing.
- MSI Afterburner monitoring guide: Temperature graphs, fan behavior, and performance monitoring.
- iFixit Thermal Pad Replacement: Thermal pad placement and heatsink reassembly considerations.
- Intel processor temperature guidance: Understanding processor-specific thermal limits.
